UNITED STATES SECURITIES AND EXCHANGE COMMISSION
Washington, D.C. 20549
FORM 10-K
x ANNUAL REPORT PURSUANT TO SECTION 13 OR 15(d) OF THE SECURITIES EXCHANGE ACT OF 1934.
For the fiscal year ended December 31, 2014
OR
o TRANSITION REPORT PURSUANT TO SECTION 13 OR 15(d) OF THE SECURITIES EXCHANGE ACT OF 1934.
For the transition period from to
Commission file number: 000-26408
WAYSIDE TECHNOLOGY GROUP, INC.
(Exact name of registrant as specified in its charter)
|
Delaware |
|
13-3136104 |
|
(State or other jurisdiction of incorporation) |
|
(IRS Employer Identification Number) |
|
|
|
|
|
1157 Shrewsbury Avenue, Shrewsbury, New Jersey |
|
07702 |
|
(Address of principal executive offices) |
|
(Zip Code) |
Registrant’s telephone number, including area code: (732) 389-8950
Securities registered pursuant to section 12(b) of the Act:
|
Title of Each Class |
|
Name of Each Exchange on Which Registered |
|
Common Stock, par value $0.01 per share |
|
The NASDAQ Global Market |
Securities registered pursuant to section 12(g) of the Act: None
Indicate by check mark if the registrant is a well-known seasoned issuer, as defined in Rule 405 of the Securities Act.
Yes o No x
Indicate by check mark if the registrant is not required to file reports pursuant to Section 13 or Section 15(d) of the Act.
Yes o No x
Indicate by check mark whether the Registrant: (1) has filed all reports required to be filed by Section 13 or 15(d) of the Securities Exchange Act of 1934 during the preceding 12 months (or for such shorter period that the Registrant was required to file such reports), and (2) has been subject to such filing requirements for the past 90 days. Yes x No o
Indicate by check mark whether the registrant has submitted electronically and posted on its corporate Web site, if any, every Interactive Data file required to be submitted and posted pursuant to Rule 405 of Regulation S-T (§232.405 of this chapter) during the preceding 12 months (or for such shorter period that the registrant was required to submit and post such files). Yes x No o
Indicate by check mark if disclosure of delinquent filers pursuant to Item 405 of Regulation S-K (§229.405 of this chapter) is not contained herein, and will not be contained, to the best of Registrant’s knowledge, in definitive proxy or other information statements incorporated by reference in Part III of this Form 10-K or any amendment to this Form 10-K. o
Indicate by check mark whether the registrant is a large accelerated filer, an accelerated filer, a non-accelerated filer or a smaller reporting company. See the definitions of “large accelerated filer,” “accelerated filer” and “smaller reporting company” in Rule 12b-2 of the Exchange Act. (Check one): Large accelerated filer o Accelerated filer o Non-accelerated filer o Smaller Reporting Company x
Indicate by check mark whether the registrant is a shell company (as defined in Rule 12b-2 of the Act). Yes o No x
The aggregate market value of the Common Stock held by non-affiliates of the Registrant computed by reference to the closing sale price for the Registrant’s Common Stock as of June 30, 2014, which was the last business day of the Registrant’s most recently completed second fiscal quarter, as reported on The NASDAQ Global Market, was approximately $59,421,953 (In determining the market value of the Common Stock held by any non-affiliates, shares of Common Stock of the Registrant beneficially owned by directors, officers and holders of more than 10% of the outstanding shares of Common Stock of the Registrant have been excluded. This determination of affiliate status is not necessarily a conclusive determination for other purposes).
The number of shares outstanding of the Registrant’s Common Stock as of February 13, 2015 was 4,915,140 shares.
Documents Incorporated by Reference: Portions of the Registrant’s definitive Proxy Statement for its 2015 Annual Meeting of Stockholders to be filed on or before April 30, 2015 are incorporated by reference into Part III of this Report.
PART I
Item 1 Business
General
Wayside Technology Group, Inc. and Subsidiaries (the “Company,” “us,” “we,” or “our”) is an information technology (“IT”) channel company. We distribute software developed by others through resellers indirectly to customers worldwide. We also resell computer software and hardware developed by others and provide technical services directly to customers in the United States of America (“USA”) and Canada. We offer an extensive line of products from leading publishers of software and tools for virtualization/cloud computing, security, networking, storage & infrastructure management, application lifecycle management and other technically sophisticated domains as well as computer hardware.
Wayside Technology Group, Inc. was incorporated in Delaware in 1982. Our Common Stock is listed on The NASDAQ Global Market under the symbol “WSTG”. Our main web site address is www.waysidetechnology.com, and the other web sites maintained by our business include www.lifeboatdistribution.com, and www.techxtend.com. Reference to these “uniform resource locators” or “URLs” is made as an inactive textual reference for informational purposes only. Information on our web sites should not be considered filed with the Securities and Exchange Commission, and is not, and should not be deemed to be, a part of this report.
The Company operates through two reportable operating segments. The “Lifeboat Distribution” segment distributes technical software to corporate resellers, value added resellers (VARs), consultants and systems integrators worldwide. The “TechXtend” segment is a value-added reseller of software, hardware and services for corporations, government organizations and academic institutions in the USA and Canada. For each of our segments, sales from unaffiliated customers, income and total assets, among other financial information, is presented in Note 9 in the Notes to our Consolidated Financial Statements.
Competition
The software market is highly competitive. Pricing is very aggressive in both software distribution and reselling. The Company expects pricing pressure to continue. The Company faces competition from a wide variety of sources. In the Lifeboat Distribution segment, we compete against much larger broad-line distributors, as well as specialty distributors and, in some cases, the direct sales teams of the vendors we represent also sell directly to the end-customers. In the TechXtend segment, we also compete against vendors who sell directly to customers, as well as software resellers, superstores, e-commerce vendors, and other direct marketers of software and hardware products. In both segments, some of our competitors are significantly larger and have substantially greater resources than the Company. Many of our competitors compete principally on the basis of price, product availability, customer service and technical support.
There can be no assurance that the Company can compete effectively against existing competitors or new competitors that may enter the market or that it can generate profit margins which represent a fair return to the Company. In addition, price is an important competitive factor in the personal computer software market and there can be no assurance that the Company will not be subject to increased price competition. An increase in the amount of competition faced by the Company, or its failure to compete effectively against its competitors, could have a material adverse effect on the Company’s business, financial condition and results of operations.
The Company competes to attract prospective buyers and in sourcing new products from software developers and publishers, as well as in marketing its current product line to its customers. The Company believes that its ability to offer software developers and IT professionals easy access to a wide selection of
2
the right IT products at reasonable prices with prompt delivery and high customer service levels, along with its good relationships with vendors and suppliers, allows it to compete effectively in acquiring prospective buyers and marketing its current product line to its customers. The Company competes to gain distribution rights for new products primarily on the basis of its reputation and its relationships with software publishers.
The market for the software products we sell is characterized by rapid changes in technology, user requirements, and customer specifications. The manner in which software products are distributed and sold is changing, and new methods of distribution and sale may emerge or expand. Software developers and publishers have sold, and may intensify their efforts to sell, their products directly to end-users. The continuing evolution of the Internet as a platform in which to conduct e-commerce business transactions has both lowered the barriers for competition and broadened customer access to products and information, increasing competition and reducing prices. From time to time, certain software developers and publishers have instituted programs for the direct sale of large order quantities of software to certain major corporate accounts. These types of programs may continue to be developed and used by various developers and publishers. While software developers and publishers currently sell new releases or upgrades directly to end users, they have not attempted to completely bypass the distribution and reseller channels. There can be no assurances, however, that software developers and publishers will continue using distributors and resellers to the same extent they currently do. Future efforts by software developers and publishers to bypass third- party sales channels could materially and adversely affect the Company’s business operations and financial conditions.
In addition, resellers and publishers may attempt to increase the volume of software products distributed electronically through ESD (Electronic Software Distribution) technology, through subscription services, and through on-line shopping services. Any of these competitive programs, if successful, could have a material adverse effect on the Company’s business, results of operations and financial condition. For a description of additional risks relating to competition in our industry, please refer to “Item 1.A. Risk Factors”: “We rely on our suppliers for product availability, marketing funds, purchasing incentives and competitive products to sell”, and “The IT products and services industry is intensely competitive and actions of competitors, including manufacturers of products we sell, can negatively affect our business”.
Products
An essential part of our ongoing operations and growth plans is the continued recruitment of software publishers for which we can sell their products. The Company offers a wide variety of technology products from a broad range of publishers and manufacturers, such as Acronis, Bluebeam Software, CA Technologies, Dell/Dell Software, Flexera Software, Hewlett Packard, Infragistics, Intel Software, JetBrains, Lenovo, Microsoft, Mindjet, Samsung, SAP/Sybase, SmartBear Software, SolarWinds, Sophos, StorageCraft Technology, TechSmith, Telerik, Unitrends, Veeam Software and VMware. On a continuous basis, we screen new products for inclusion in our direct sales portfolio, catalogs and web sites based on their features, quality, price, profit margins and warranties, as well as on current sales trends. Since the Company predominantly sells software, sales of hardware and peripherals represented only 7% , 6% and 4% of our overall net sales in 2014, 2013 and 2012, respectively.
Marketing and Distribution
We market products through creative marketing communications, including our web sites, local and on-line seminars, print and electronic catalogs. We also use direct e-mail and printed material to introduce new products and upgrades, to cross-sell products to current customers, and to educate and inform existing and potential customers. We believe that our blend of electronic and traditional marketing and selling programs are important marketing vehicles for software publishers and manufacturers. These programs provide a cost-effective and service-oriented means to market and sell and fulfill software products and meet the needs of users.
3
The Company had three customers that each accounted for more than 10% of total sales for 2014. For the year ended December 31, 2014, Software House International Corporation (“SHI”), CDW Corporation (“CDW”) and Insight Enterprises, Inc. (“Insight”) accounted for 17.4%, 16.4% and 11.0%, respectively, of consolidated net sales and, as of December 31, 2014, 15.3%, 17.9%, and 7.9%, respectively, of total net accounts receivable. For the year ended December 31, 2013, SHI, CDW and Insight accounted for 14.9%, 13.8% and 12.2%, respectively, of consolidated net sales. For the year ended December 31, 2012, SHI, CDW, and Insight accounted for 13.4%, 12.4% and 11.1%, respectively, of consolidated net sales. Our top five customers accounted for 52%, 48%, and 44% of consolidated net sales in 2014, 2013 and 2012, respectively. The Company generally ships products within 48 hours of confirming a customer’s order. This results in minimum backlog in the business.
Sales to customers in Canada represented 7% of our consolidated revenues in each of 2014, 2013 and 2012. For geographic financial information, please refer to Note 9 in the Notes to our Consolidated Financial Statements.
Customer Support
We believe that providing a high level of customer service is necessary to compete effectively and is essential to continued sales and revenue growth. Our account representatives assist our customers with all aspects of purchasing decisions, process products ordered and respond to customer inquiries on order status, product pricing and availability. The account representatives are trained to answer all basic questions about the features and functionality of products. To deal with technical issues, we maintain an in-house technical support staff.
Purchasing and Fulfillment
The Company’s success is dependent, in part, upon the ability of its suppliers to develop and market products that meet the changing requirements of the marketplace. The Company believes it enjoys good relationships with its vendors. The Company and its principal vendors have cooperated frequently in product introductions and in other marketing programs. As is customary in the industry, the Company has no long-term supply contracts with any of its suppliers. Substantially all of the Company’s contracts with its vendors are terminable upon 30 days’ notice or less. Moreover, the manner in which software products are distributed and sold is changing, and new methods of distribution and sale may emerge or expand. Software publishers have sold, and may intensify their efforts to sell, their products directly to end-users. The Company’s business and results of operations may be adversely affected if the terms and conditions of the Company’s authorizations with its vendors were to be significantly modified or if certain products become unavailable to the Company.
We believe that effective purchasing from a diverse vendor base is a key element of our business strategy. For the year ended December 31, 2014, Sophos was the only individual vendor from whom our purchases exceeded 10% of our total purchases and accounted for 14.7% of our total purchases. For the year ended December 31, 2013, Dell/Quest Software was the only individual vendor from whom our purchases exceeded 10% of our total purchases and accounted for 10.2% of our total purchases. For the year ended December 31, 2012, Dell/Quest Software was the only individual vendor from whom our purchases exceeded 10% of our total purchases and accounted for 13.4% of our total purchases. The loss of a key vendor or group of vendors could disrupt our product availability and otherwise have an adverse effect on the Company.
In 2014, the Company purchased approximately 95% of its products directly from manufacturers and publishers and the balance from multiple distributors, as compared to 93% and 91% in 2013 and 2012, respectively. Most suppliers or distributors will “drop ship” products directly to the customers, which reduces physical handling by the Company. Inventory management techniques, such as “drop shipping” allow the Company to offer a greater range of products without increased inventory requirements or associated risk.
4
Inventory levels may vary from period to period, due in part to increases or decreases in sales levels, the Company’s practice of making large-volume purchases when it deems the terms of such purchases to be attractive, and the addition of new suppliers and products. Moreover, the Company’s order fulfillment and inventory control systems allow the Company to order certain products just in time for next day shipping. The Company promotes the use of electronic data interchange (“EDI”) with its suppliers, which helps reduce overhead and the use of paper in the ordering process. Although brand names and individual products are important to our business, we believe that competitive sources of supply are available for substantially all of the product categories we carry.
The Company operates distribution facilities in Shrewsbury, New Jersey and Mississauga, Canada.
Management Information Systems
The Company operates management information systems on Windows 2003 and Windows 2008 platforms that allow for centralized management of key functions, including inventory, accounts receivable, purchasing, sales and distribution. We are dependent on the accuracy and proper utilization of our information technology systems, including our telephone, web sites, e-mail and fax systems.
The management information systems allow the Company to monitor sales trends, provide real-time product availability and order status information, track direct marketing campaign performance and to make marketing event driven purchasing decisions. In addition to the main system, the Company has systems of networked personal computers, as well as microcomputer-based desktop publishing systems, which facilitate data sharing and provide an automated office environment.
The Company recognizes the need to continually upgrade its management information systems to most effectively manage its operations and customer database. In that regard, the Company anticipates that it will, from time to time, require software and hardware upgrades for its present management information systems.
Trademarks
The Company conducts its business under various trademarks and service marks including Lifeboat Distribution and TechXtend. The Company protects these trademarks and service marks and believes that they have significant value to us and are important factors in our marketing programs.
Employees
As of December 31, 2014, Wayside Technology Group, Inc. and its subsidiaries had 124 full-time employees and 1 part-time employee. The Company is not a party to any collective bargaining agreements with its employees, has experienced no work stoppages and considers its relationships with its employees to be satisfactory.
Executive Officers of the Company
Set forth below are the name, age, present title, principal occupation and certain biographical information for our executive officers as of February 1, 2015, all of whom have been appointed by and serve at the discretion of the Board of Directors of the Company (the “Board of Directors”).
|
Name |
|
Age |
|
Position |
|
Simon F. Nynens |
|
43 |
|
Chairman, President and Chief Executive Officer |
|
William Botti |
|
64 |
|
Executive Vice President |
|
Kevin Scull |
|
49 |
|
Vice President and Chief Accounting Officer |
|
Vito Legrottaglie |
|
50 |
|
VP of Operations and Chief Information Officer |
|
Richard J. Bevis |
|
65 |
|
Vice President of Marketing |
5
Simon F. Nynens was appointed President and Chief Executive Officer in January 2006. Mr. Nynens also serves on the Board of Directors and was named Chairman in June 2006. He previously held the position of Executive Vice President and Chief Financial Officer (June 2004 - January 2006) and Vice President and Chief Financial Officer (January 2002 - June 2004). Prior to January 2002, Mr. Nynens served as the Vice President and Chief Operating Officer of the Company’s European operations.
William Botti was appointed Executive Vice President in April 2014. Mr. Botti has extensive experience in all three provider aspects of the technology channel — software vendor, distributor and reseller. He is a recognized industry leader, having founded three successful technology companies. Among his varied experiences, Mr. Botti has served as chief executive officer, president and chief operating officer of Alternative Technology Inc., prior and subsequent to its acquisition by Arrow ECS, as vice president of North American sales at Veeam Software, Inc., and as founder, president and CEO of Computer Networks, Inc.
Kevin Scull was appointed to the position of Vice President and Chief Accounting Officer in February 2015, after having served as the Vice President and Interim Chief Financial Officer since February 2014. He previously held the position of Vice President and Chief Accounting Officer from January 2006 to August 2012, after having served as Corporate Controller of the company since January 2003. Prior to joining Wayside Technology Group, Inc., Mr. Scull worked for Niksun Inc. as Accounting Manager from January 2001to January 2003 and, prior to that, he worked for Telcordia Inc. from December 2000 to January 2001, as Manager of Accounting Policies.
Vito Legrottaglie was appointed to the position of Vice President and Chief Information Officer in February 2015, after having served as Vice President of Operations and Information Systems since April 2007. Mr. Legrottaglie rejoined the company in February 2003 having previously served as director of Information Systems and then vice president of Information Systems from 1996-2000. Mr. Legrottaglie has also held the positions of chief technology officer at Swell Commerce Incorporated, vice president of Operations for The Wine Enthusiast Companies, and director of Information Systems at Barnes and Noble
Richard J. Bevis was appointed Vice President Marketing in July 2007. Prior to joining Wayside Technology Group, Inc., Mr. Bevis worked for Covance Inc., a drug development service company, as Senior Director Marketing Communication from 2003 to 2007. He also held the position of Vice President of Corporate Communications for Eyretel, PLC. from 2002 to 2003.
Available Information
Under the Securities Exchange Act of 1934, as amended (the “Exchange Act”), the Company is required to file annual, quarterly and current reports, proxy and information statements and other information with the SEC. You may read and copy any document we file with the SEC at the SEC’s public reference room at 100 F Street, N.E., Washington, D.C. 20549. Please call the SEC at 1-800-SEC-0330 for further information about the public reference room. The SEC maintains a web site at http://www.sec.gov that contains reports, proxy and information statements, and other information regarding issuers that file electronically with the SEC. The Company files electronically with the SEC. The Company makes available, free of charge, through its internet web site, its reports on Forms 10-K, 10-Q and 8-K, and amendments to those reports, as soon as reasonably practicable after they are filed with the SEC. The following address for the Company’s web site includes a hyperlink to those reports under “Financials/SEC Filings”: http://www.waysidetechnology.com.
In January 2004, we adopted a Code of Ethical Conduct. The full text of the Code of Ethical Conduct, which applies to all employees, officers and directors of the Company, including our Chief Executive Officer and Chief Financial Officer, is available at our web site,
6
http://www.waysidetechnology.com, under “Corporate Governance.” The Company intends to disclose any amendment to, or waiver from, a provision of the Code of Ethical Conduct that applies to its Chief Executive Officer or Chief Financial Officer on its web site under “Investor Information.”
Reference to the “uniform resource locators” or “URLs” contained in this section is made as an inactive textual reference for informational purposes only. Information on our web sites should not be considered filed with the Securities and Exchange Commission, and is not, and should not be deemed to be part of this report.
Item 1A. Risk Factors
Investors should carefully consider the risk factors set forth below as well as the other information contained in this report. Any of the following risks could materially and adversely affect our business, financial condition or results of operations. Additional risks and uncertainties not currently known to us or those currently viewed by us to be immaterial may also materially and adversely affect our business, financial condition or results of operations.
Changes in the information technology industry and/or economic environment may reduce demand for the products and services we sell. Our results of operations are influenced by a variety of factors, including the condition of the IT industry, general economic conditions, shifts in demand for, or availability of, computer products and software and IT services and industry introductions of new products, upgrades or methods of distribution. The information technology products industry is characterized by abrupt changes in technology, rapid changes in customer preferences, short product life cycles and evolving industry standards. Net sales can be dependent on demand for specific product categories, and any change in demand for or supply of such products could have a material adverse effect on our net sales, and/or cause us to record write-downs of obsolete inventory, if we fail to react in a timely manner to such changes.
We rely on our suppliers for product availability, marketing funds, purchasing incentives and competitive products to sell. We acquire products for resale both directly from manufacturers and indirectly from distributors. The loss of a supplier could cause a disruption in the availability of products. Additionally, there is no assurance that as manufacturers continue to or increasingly sell directly to end users and through the distribution channel, that they will not limit or curtail the availability of their products to distributors/resellers like us. For example, resellers and publishers may attempt to increase the volume of software products distributed electronically through ESD (Electronic Software Distribution) technology, through subscription services, and through on-line shopping services, and correspondingly, decrease the volume of products sold through us. Our inability to obtain a sufficient quantity of products, or an allocation of products from a manufacturer in a way that favors one of our competitors, or competing distribution channels, relative to us, could cause us to be unable to fill clients’ orders in a timely manner, or at all, which could have a material adverse effect on our business, results of operations and financial condition. We also rely on our suppliers to provide funds for us to market their products, including through our catalogs and on-line marketing efforts, and to provide purchasing incentives to us. If any of the suppliers that have historically provided these benefits to us decides to reduce such benefits, our expenses would increase, adversely affecting our results of operations.
General economic weakness may reduce our revenues and profits. The ongoing effects of the general economic downturn, especially outside of the USA, continues to cause some of our current and potential customers to delay or reduce technology purchases, resulting in longer sales cycles, slower adoption of new technologies and increased price competition. We may, therefore, experience a greater decline in demand for the products we sell, resulting in increased competition and pressure to reduce the cost of operations. Any benefits from cost reductions may take longer to realize and may not fully mitigate the impact of the reduced demand. In addition, weak financial and credit markets heighten the risk of customer bankruptcies and create a corresponding delay in collecting receivables from those customers and
7
may also affect our vendors’ ability to supply products, which could disrupt our operations. The realization of any or all of these risks could have a material adverse effect on our business, results of operations and financial condition.
We Depend on Having Creditworthy Customers to Avoid an Adverse Impact to Our Operating Results and Financial Condition. We require sufficient amounts of debt and equity capital to fund our transactions as we provide larger extended payment terms to certain of our customers. If the credit quality of our customer base materially decreases, or if we experience a material increase in our credit losses, we may find it difficult to continue to obtain the required capital for our business, and our operating results and financial condition may be harmed. In addition to the impact on our ability to attract capital, a material increase in our delinquency and default experience would itself have a material adverse effect on our business, operating results and financial condition. Furthermore, if any of our customers to whom we provide larger extended payment terms go elsewhere for financing, such loss of financing revenue could have a material adverse effect on our business, operating results and financial condition.
The IT products and services industry is intensely competitive and actions of competitors, including manufacturers of products we sell, can negatively affect our business. Competition has been based primarily on price, product availability, speed of delivery, credit availability and quality and breadth of product lines and, increasingly, also is based on the ability to tailor specific solutions to client needs. We compete with manufacturers, including manufacturers of products we sell, as well as a large number and wide variety of marketers and resellers of IT products and services. In addition, manufacturers are increasing the volume of software products they distribute electronically directly to end-users and in the future will likely pay lower referral fees for sales of certain software licensing agreements sold by us. Generally, pricing is very aggressive in the industry, and we expect pricing pressures to continue. There can be no assurance that we will be able to negotiate prices as favorable as those negotiated by our competitors or that we will be able to offset the effects of price reductions with an increase in the number of clients, higher net sales, cost reductions, or greater sales of services, which service sales typically at higher gross margins, or otherwise. Price reductions by our competitors that we either cannot or choose not to match could result in an erosion of our market share and/or reduced sales or, to the extent we match such reductions, could result in reduced operating margins, any of which could have a material adverse effect on our business, results of operations and financial condition.
Disruptions in our information technology and voice and data networks could affect our ability to service our clients and cause us to incur additional expenses. We believe that our success to date has been, and future results of operations likely will be, dependent in large part upon our ability to provide prompt and efficient service to clients. Our ability to provide such services is dependent largely on the accuracy, quality and utilization of the information generated by our IT systems, which affect our ability to manage our sales, client service, distribution, inventories and accounting systems and the reliability of our voice and data networks.
Failure to adequately maintain the security of our electronic and other confidential information could materially adversely affect our financial condition and results of operations. We are dependent upon automated information technology processes. Privacy, security, and compliance concerns have continued to increase as technology has evolved to facilitate commerce and as cross-border commerce increases. As part of our normal business activities, we collect and store certain confidential information, including personal information of employees and information about partners and clients which may be entitled to protection under a number of regulatory regimes. In the course of normal and customary business practice, we may share some of this information with vendors who assist us with certain aspects of our business. Moreover, the success of our operations depends upon the secure transmission of confidential and personal data over public networks, including the use of cashless payments. Any failure on the part of us or our vendors to maintain the security of data we are required to protect, including via the penetration of our network security and the misappropriation of confidential and personal information, could result in business
8
disruption, damage to our reputation, financial obligations to third parties, fines, penalties, regulatory proceedings and private litigation with potentially large costs, and also result in deterioration in our employees’, partners’ and clients’ confidence in us and other competitive disadvantages, and thus could have a material adverse impact on our business, financial condition and results of operations. During 2014 and 2013 we did not have any cybersecurity breaches.
We depend on certain key personnel. Our future success will be largely dependent on the efforts of key management personnel for strategic and operational guidance as well as relationships with our key vendors and customers. We also believe that our future success will be largely dependent on our continued ability to attract and retain highly qualified management, sales, service, finance and technical personnel. We cannot assure you that we will be able to attract and retain such personnel. Further, we make a significant investment in the training of our sales account executives. Our inability to retain such personnel or to train them either rapidly enough to meet our expanding needs or in an effective manner for quickly changing market conditions could cause a decrease in the overall quality and efficiency of our sales staff, which could have a material adverse effect on our business, results of operations and financial condition.
Risks Related to Our Common Stock. The exercise of outstanding options or any other issuance of shares by us may dilute your ownership of our Common Stock. Our Common Stock is thinly traded, which may be exacerbated by our repurchases of our Common Stock. As a result of the thin trading market for our stock, its market price may fluctuate significantly more than the stock market as a whole or of the stock prices of similar companies. Without a larger float, our common stock will be less liquid than the stock of companies with broader public ownership, and, as a result, the trading prices for our Common Stock may be more volatile. Among other things, trading of a relatively small volume of our Common Stock may have a greater impact on the trading price of our stock than would be the case if our public float were larger.
Our common stock is listed on The NASDAQ Global Market, and we therefore are subject to continued listing requirements, including requirements with respect to the market value and number of publicly-held shares, number of stockholders, minimum bid price, number of market makers and either (i) stockholders’ equity or (ii) total market value of stock, total assets and total revenues. If we fail to satisfy one or more of the requirements, we may be delisted from The NASDAQ Global Market. If we do not qualify for listing on The NASDAQ Capital Market, and if we are not able to list our common stock on another exchange, our common stock could be quoted on the OTC Bulletin Board or on the “pink sheets”. As a result, we could face significant adverse consequences including, among others, a limited availability of market quotations for our securities and a decreased ability to issue additional securities or obtain additional financing in the future.
Item 1B. Unresolved Staff Comments
Not applicable.
Item 2. Properties
The Company leases 18,000 square feet of space in Shrewsbury, New Jersey for its corporate headquarters under a lease expiring in February 2016. Total annual rent expense for these premises is approximately $225,000. The Company also leases 7,800 square feet of warehouse space in Eatontown, New Jersey under a lease expiring in October 2017. Total annual rent expense is approximately $40,000. Additionally, the Company leases approximately 3,700 square feet of office and warehouse space in Mississauga, Canada, under a lease which expires November 30, 2016. Total annual rent expense for these premises is approximately $30,000. The Company also leases approximately 150 square feet of office space in Almere, Netherlands under a lease which expires October 31, 2015, at an annual rent of approximately $12,000. We believe that each of the properties is in good operating condition and such properties are adequate for the operation of the Company’s business as currently conducted.
9
Item 3. Legal Proceedings
There are no material legal proceedings to which the Company or any of its subsidiaries is a party or of which any of their property is the subject.
Item 4. Mine Safety Disclosures
Not applicable.
PART II
Item 5. Market for Registrant’s Common Equity, Related Stockholder Matters and Issuer Purchases of Equity Securities
Shares of our Common Stock, par value $0.01, trade on The NASDAQ Global Market under the symbol “WSTG”. Following is the range of low and high closing sales prices for our Common Stock as reported on The NASDAQ Global Market.
|
|
|
High |
|
Low |
|
|
2014: |
|
|
|
|
|
|
First Quarter |
|
$ |
19.84 |
|
$ |
13.76 |
|
|
Second Quarter |
|
$ |
22.77 |
|
$ |
14.69 |
|
|
Third Quarter |
|
$ |
17.64 |
|
$ |
14.88 |
|
|
Fourth Quarter |
|
$ |
17.96 |
|
$ |
15.53 |
|
|
|
|
|
|
|
|
|
2013: |
|
|
|
|
|
|
First Quarter |
|
$ |
13.05 |
|
$ |
11.25 |
|
|
Second Quarter |
|
$ |
12.18 |
|
$ |
11.13 |
|
|
Third Quarter |
|
$ |
12.95 |
|
$ |
11.40 |
|
|
Fourth Quarter |
|
$ |
13.93 |
|
$ |
12.74 |
|
In each of 2014 and 2013, we declared quarterly dividends totaling $0.68 and $0.65 per share, respectively, on our Common Stock. Our dividend declared and paid in the fourth quarter of 2013 was increased from $0.16 per share (declared and paid in the first, second and third quarter of 2013) to $0.17 per share. There can be no assurance that we will continue to pay comparable cash dividends in the future.
During 2014, the Company granted a total of 98,689 shares of Restricted Stock to officers, directors and employees. These shares of Restricted Stock vest between one and twenty equal quarterly installments. A total of 34,487 shares of Restricted Stock were forfeited as a result of officers and employees terminating employment with the Company.
During 2013, the Company granted a total of 56,500 shares of Restricted Stock to officers and employees. Included in these grants were 40,000 Restricted Shares granted to the Company’s CEO in accordance with the satisfaction of certain performance criteria included in his compensation plan. These 40,000 Restricted Shares vest over 16 equal quarterly installments. The remaining grants of Restricted Stock vest over 20 equal quarterly installments. A total of 775 shares of Restricted Stock were forfeited as a result of employees terminating employment with the Company.
10
The share issuances in all of the above transactions were not registered under the Securities Act of 1933, as amended (the “Securities Act”). The issuances were exempt from registration pursuant to Section 4(2) of the Securities Act and/or Regulation D thereunder, as they were transactions by the issuer that did not involve public offerings of securities and/or involved issuances to accredited investors.
As of January 30, 2015, there were approximately 29 record holders of our Common Stock. This figure does not include an estimate of the number of beneficial holders whose shares are held of record by brokerage firms and clearing agencies.
During the fourth quarter of 2014, we repurchased shares of our Common Stock as follows:
|
|
|
Total Number of
Shares |
|
Average
Price Paid
Per Share |
|
Total
Number of
Shares
Purchased
as Part of
Publicly
Announced
Plans or |
|
Average
Price
Paid Per
Share |
|
Maximum
Number of
Shares That
May Yet Be
Purchased
Under the Plans
or Programs |
|
|
Period |
|
Purchased |
|
(2) |
|
Programs |
|
(3) |
|
(4)(5) |
|
|
|
|
|
|
|
|
|
|
|
|
|
|
|
October 1- October 31, 2014 |
|
— |
|
— |
|
— |
|
— |
|
214,947 |
|
|
November 1- November 30, 2014 (1) |
|
15,398 |
|
$ |
17.16 |
|
8,000 |
|
$ |
17.13 |
|
206,947 |
|
|
December 1 - December 31, 2014 |
|
3,000 |
|
$ |
17.40 |
|
3,000 |
|
$ |
17.40 |
|
703,947 |
|
|
Total |
|
18,398 |
|
$ |
17.20 |
|
11,000 |
|
$ |
17.20 |
|
703,947 |
|
(1) Includes 7,398 shares surrendered to the Company by employees to satisfy individual tax withholding obligations upon vesting of previously issued shares of Restricted Stock. These shares are not included in the Common Stock repurchase program referred to in footnote (4) below.
(2) Average price paid per share reflects the closing price of the Company’s Common Stock on the business date the shares were surrendered by the employee stockholder to satisfy individual tax withholding obligations upon vesting of Restricted Stock or the price of the Common Stock paid on the open market purchase, as applicable.
(3) Average price paid per share reflects the price of the Company’s Common Stock purchased on the open market.
(4) On July 31, 2008, the Company approved the increase of its Common Stock repurchase program by 500,000 shares. On December 3, 2014, the Board of Directors of the Company approved an increase of 500,000 shares of Common Stock to the number of shares of Common Stock available for repurchase under its repurchase plans. The Company expects to purchase shares of its Common Stock from time to time in the market or otherwise subject to market conditions. The Common Stock repurchase program does not have an expiration date.
(5) The Company’s Rule 10b5-1 plan (the “ 2012 10b5-1 plan”) which became effective on October 29, 2012, terminated by its own terms on October 29, 2014. Accordingly no further purchases of the Company’s Common Stock may be effected under its 2012 10b5-1.
11
On October 29, 2014, the Board of Directors approved, and on November 10, 2014, the Company entered into a written purchase plan intended to comply with the requirements of Rule 10b5-1 under the Exchange Act, as amended (the “Plan”). Purchases involving shares of the Company’s Common Stock under the Plan commenced November 10, 2014, and the Plan is intended to be in effect until May 10, 2015. Pursuant to the Plan, the Company’s broker shall effect purchases of up to an aggregate of 210,000 shares of Common Stock.
STOCK PRICE PERFORMANCE GRAPH
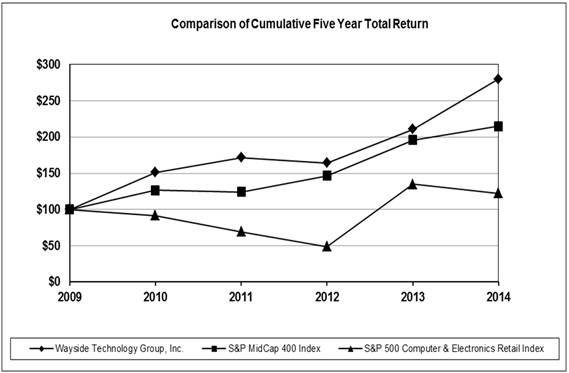
Set forth below is a line graph comparing the yearly percentage change in the cumulative total shareholder return on the Company’s Common Stock with the cumulative total return of the S&P Midcap 400 Index and the S&P 500 Computer and Electronics Retail Index for the period commencing December 31, 2008 and ending December 31, 2014, assuming $100 was invested on December 31, 2009 and the reinvestment of dividends.
|
|
|
Base |
|
INDEXED RETURNS |
|
|
|
|
Period |
|
Years Ending |
|
|
Company / Index |
|
Dec09 |
|
Dec10 |
|
Dec11 |
|
Dec12 |
|
Dec13 |
|
Dec14 |
|
|
Wayside Technology Group, Inc. |
|
100 |
|
150.98 |
|
171.64 |
|
164.22 |
|
210.95 |
|
279.95 |
|
|
S&P MidCap 400 Index |
|
100 |
|
126.64 |
|
124.45 |
|
146.69 |
|
195.84 |
|
214.97 |
|
|
S&P 500 Computer & Electronics Retail Index |
|
100 |
|
91.88 |
|
69.42 |
|
48.98 |
|
134.85 |
|
122.51 |
|
12
Item 6. Selected Financial Data
The following tables set forth, for the periods indicated, selected consolidated financial and other data for Wayside Technology Group, Inc. and its Subsidiaries. You should read the selected consolidated financial and other data below in conjunction with our consolidated financial statements and the related notes and with “Item 7. Management’s Discussion and Analysis of Financial Condition and Results of Operations” included elsewhere in this Form 10-K.
Year Ended December 31,
(Amounts in thousands, except per share amounts)
|
|
|
2014 |
|
2013 |
|
2012 |
|
2011 |
|
2010 |
|
|
Consolidated Statement of Operations Data: |
|
|
|
|
|
|
|
|
|
|
|
|
Net sales |
|
$ |
340,758 |
|
$ |
300,390 |
|
$ |
297,057 |
|
$ |
250,169 |
|
$ |
206,730 |
|
|
Cost of sales |
|
315,948 |
|
276,035 |
|
273,165 |
|
226,928 |
|
186,720 |
|
|
Gross profit |
|
24,810 |
|
24,355 |
|
23,892 |
|
23,241 |
|
20,010 |
|
|
Selling, general and |
|
|
|
|
|
|
|
|
|
|
|
|
administrative expenses |
|
16,513 |
|
15,505 |
|
15,377 |
|
14,623 |
|
13,207 |
|
|
Income from operations |
|
8,297 |
|
8,850 |
|
8,515 |
|
8,618 |
|
6,803 |
|
|
Other income, net |
|
461 |
|
562 |
|
574 |
|
369 |
|
407 |
|
|
Income before provision for income taxes |
|
8,758 |
|
9,412 |
|
9,089 |
|
8,987 |
|
7,210 |
|
|
Provision for income taxes |
|
2,998 |
|
3,019 |
|
3,600 |
|
3,448 |
|
2,789 |
|
|
Net income |
|
$ |
5,760 |
|
6,393 |
|
$ |
5,489 |
|
$ |
5,539 |
|
$ |
4,421 |
|
|
Net income per common share |
|
|
|
|
|
|
|
|
|
|
|
|
Basic |
|
$ |
1.24 |
|
$ |
1.44 |
|
$ |
1.23 |
|
$ |
1.26 |
|
$ |
1.01 |
|
|
Diluted |
|
$ |
1.23 |
|
$ |
1.41 |
|
$ |
1.19 |
|
$ |
1.20 |
|
$ |
0.98 |
|
|
Weighted average common shares outstanding: |
|
|
|
|
|
|
|
|
|
|
|
|
Basic |
|
4,661 |
|
4,454 |
|
4,476 |
|
4,412 |
|
4,386 |
|
|
Diluted |
|
4,702 |
|
4,526 |
|
4,628 |
|
4,606 |
|
4,500 |
|
December 31,
(Amounts in thousands, except per share amounts)
|
|
|
2014 |
|
2013 |
|
2012 |
|
2011 |
|
2010 |
|
|
Balance Sheet Data: |
|
|
|
|
|
|
|
|
|
|
|
|
Cash and cash equivalents |
|
$ |
23,124 |
|
$ |
19,609 |
|
$ |
9,835 |
|
$ |
9,202 |
|
$ |
10,955 |
|
|
Marketable securities |
|
— |
|
— |
|
4,411 |
|
5,375 |
|
4,528 |
|
|
Working capital |
|
31,161 |
|
24,016 |
|
19,592 |
|
19,337 |
|
19,033 |
|
|
Total assets |
|
94,981 |
|
94,760 |
|
91,445 |
|
74,861 |
|
68,683 |
|
|
Total stockholders’ equity |
|
39,567 |
|
34,721 |
|
32,125 |
|
28,934 |
|
26,679 |
|
|
|
|
|
|
|
|
|
|
|
|
|
|
|
|
|
|
13
Item 7. Management’s Discussion and Analysis of Financial Condition and Results of Operations
The following management’s discussion and analysis of the Company’s financial condition and results of operations should be read in conjunction with the Company’s Consolidated Financial Statements and the Notes thereto. This discussion and analysis contains, in addition to historical information, forward-looking statements that involve risks and uncertainties. Our actual results may differ materially from those anticipated in these forward-looking statements as a result of certain risks and uncertainties, including those set forth under the heading “Risk Factors” and elsewhere in this report.
Overview
The Company is organized into two reportable operating segments. The “Lifeboat Distribution” segment distributes technical software to corporate resellers, value added resellers (VARs), consultants and systems integrators worldwide. The “TechXtend” segment is a value-added reseller of software, hardware and services for corporations, government organizations and academic institutions in the USA and Canada.
We offer an extensive line of products from leading publishers of software and tools for virtualization/cloud computing, security, networking, storage and infrastructure management, application lifecycle management and other technically sophisticated domains as well as computer hardware. We market these products through direct sales, the Internet, our catalogs, direct mail programs, advertisements in trade magazines and e-mail promotions.
Forward-looking Statements
This report includes “forward-looking statements” within the meaning of Section 21E of the Exchange Act. Statements in this report regarding future events or conditions, including but not limited to statements regarding industry prospects and the Company’s expected financial position, business and financing plans, are forward-looking statements.
Although the Company believes that the expectations reflected in such forward-looking statements are reasonable, it can give no assurance that such expectations will prove to have been correct. We strongly urge current and prospective investors to carefully consider the cautionary statements and risks contained in this report, particularly the risks described under “Item 1A. Risk Factors” above. Such risks include, but are not limited to, the continued acceptance of the Company’s distribution channel by vendors and customers, the timely availability and acceptance of new products, contribution of key vendor relationships and support programs, as well as factors that affect the software industry generally.
The Company operates in a rapidly changing business, and new risk factors emerge from time to time. Management cannot predict every risk factor, nor can it assess the impact, if any, of all such risk factors on the Company’s business or the extent to which any factor, or combination of factors, may cause actual results to differ materially from those projected in any forward-looking statements.
Accordingly, forward-looking statements should not be relied upon as a prediction of actual results and readers are cautioned not to place undue reliance on these forward-looking statements, which speak only as of their dates. The Company undertakes no obligation to publicly update or revise any forward-looking statements, whether as a result of new information, future events or otherwise.
The statements concerning future sales, future gross profit margin and future selling and administrative expenses are forward looking statements involving certain risks and uncertainties such as
14
availability of products, product mix, pricing pressures, market conditions and other factors, which could result in a fluctuation of sales below recent experience.
Stock Volatility. The technology sector of the United States stock markets has experienced substantial volatility in recent periods. Numerous conditions which impact the technology sector or the stock market in general or the Company in particular, whether or not such events relate to or reflect upon the Company’s operating performance, could adversely affect the market price of the Company’s Common Stock. Furthermore, fluctuations in the Company’s operating results, announcements regarding litigation, the loss of a significant vendor or customer, increased competition, reduced vendor incentives and trade credit, higher postage and operating expenses, and other developments, could have a significant impact on the market price of the Company’s Common Stock.
Financial Overview
Net sales totaled $340.8 million in 2014 as compared to $300.4 million in 2013, representing a 13% increase. Gross profit increased by $0.5 million or 2% in 2014 as compared to 2013. Selling, general and administrative (“SG&A”) expenses increased by $1.0 million in 2014 as compared to 2013. Income from operations amounted to $8.3 million in 2014 from $8.9 million in 2013, representing a decrease of $0.6 million or 6% as compared to 2013. This decrease resulted from an increase in SGA expenses offset by the increase in total gross margin (Lifeboat Distribution segment increase was offset by a decrease in TechXtend segment), Our income before provision for income taxes decreased by $0.7 million to $8.8 million in 2014 compared to $9.4 million in 2013. We reported a net income of $5.8 million for 2014 compared to $6.4 million in 2013.
The Company’s sales, gross profit and results of operations have fluctuated and are expected to continue to fluctuate on a quarterly basis as a result of a number of factors, including but not limited to: the condition of the software industry in general, shifts in demand for software products, pricing, level of extended payment terms sales transactions, industry shipments of new software products or upgrades, the timing of new merchandise and catalog offerings, fluctuations in response rates, fluctuations in merchandise returns, adverse weather conditions that affect response, distribution or shipping, shifts in the timing of holidays and changes in the Company’s product offerings. The Company’s operating expenditures are based on sales forecasts. If sales do not meet expectations in any given quarter, operating results may be materially adversely affected.
Results of Operations
The following table sets forth for the years indicated the percentage of net sales represented by selected items reflected in the Company’s Consolidated Statements of Earnings. The year-to-year comparison of financial results is not necessarily indicative of future results:
|
|
|
Years ended December 31, |
|
|
|
|
2014 |
|
2013 |
|
2012 |
|
|
Net sales |
|
100.0 |
% |
100.0 |
% |
100.0 |
% |
|
Cost of sales |
|
92.7 |
|
91.9 |
|
92.0 |
|
|
Gross profit |
|
7.3 |
|
8.1 |
|
8.0 |
|
|
Selling, general and administrative expenses |
|
4.8 |
|
5.2 |
|
5.1 |
|
|
Income from operations |
|
2.5 |
|
2.9 |
|
2.9 |
|
|
Other income |
|
0.1 |
|
0.2 |
|
0.2 |
|
|
Income before income taxes |
|
2.6 |
|
3.1 |
|
3.1 |
|
|
Income tax provision |
|
0.9 |
|
1.0 |
|
1.2 |
|
|
Net income |
|
1.7 |
% |
2.1 |
% |
1.9 |
% |
15
Year Ended December 31, 2014 Compared to Year Ended December 31, 2013
Net Sales
Net sales for 2014 increased 13%, or $40.4 million to $340.8 million in 2014 compared to $300.4 million in 2014. Total sales for our Lifeboat Distribution segment in 2014 were $290.4 million compared to $237.7 million in 2013, representing a 22% increase. Total sales for the TechXtend segment in 2014 amounted to $50.3 million, compared to $62.8 million in 2013, representing a 20% decrease.
The 22% increase in net sales from our Lifeboat Distribution segment was mainly a result of our continued focus on the expanding virtual infrastructure-centric business, the addition of several key product lines, and the strengthening of our account penetration. The 20% decrease in net sales in the TechXtend segment was primarily due to a decrease in extended payment terms sales transactions in the fourth quarter of 2014 as compared to the same period in 2013.
Gross Profit
Gross Profit for 2014 was $24.8 million compared to $24.4 million in 2013, a 2% increase. Total gross profit for our Lifeboat Distribution segment in 2014 was $19.1 million compared to $17.4 million in 2013, representing a 10% increase. The increase in gross profit for the Lifeboat Distribution segment was due to increased sales volume. Total gross profit for our TechXtend segment in 2014 was $5.6 million compared to $6.9 million in 2013, representing a 19% decrease. The decrease in gross profit for the TechXtend segment was the result primarily of decreased software sales volume, including a decrease in large single sale transactions and extended payment terms sales transactions, offset in part by a higher gross margin in 2014 as compared to 2013.
Gross profit margin (gross profit as a percentage of net sales) for 2014 was 7.3% compared to 8.1% in 2013. Gross profit margin for our Lifeboat Distribution segment was 6.6% in 2014 compared to 7.3% in and 2013. The decrease in gross profit margin for the Lifeboat Distribution segment was primarily caused by competitive pricing pressure, reduced vendor rebates and discounts, and product mix. Gross profit margin for our TechXtend segment in 2014 was 11.2% compared to 11.0% in 2013. The Increase in gross profit dollars and the decrease in gross profit margins were primarily caused by the sales growth and product mix within our Lifeboat Distribution segment which carries lower margins than our TechXtend segment.
Vendor rebates and discounts for 2014 amounted to $1.6 million compared to $1.7 million for 2013. Vendor rebates are dependent on reaching certain targets set by our vendors. Vendors have been periodically substantially increasing their target revenues for rebate eligibility. The Company monitors gross profits and gross profit margins carefully. Price competition in our market continued to intensify in 2014, with competitors lowering their prices significantly and the Company continues to respond immediately. We anticipate that margins, as well as discounts and rebates, will continue to be affected by this current trend. To the extent that the Company finances larger transactions with extended payment terms, as anticipated, gross margins also will be negatively impacted.
Selling, General and Administrative Expenses
Total selling, general and administrative (“SG&A”) expenses for 2014 were $16.5 million compared to $15.5 million in 2013, representing an increase of $1.0 million or 6.5%. This increase is primarily the result of an increase in salaries, commissions and bonus expense for our Lifeboat Distribution segment due to our growth in this segment. SG&A expenses as a percentage of net sales were 4.8% in 2014 compared to 5.2% in 2013.
Direct selling costs (a component of SG&A) for 2014 were $8.8 million compared to $8.0 million in 2013. Total direct selling costs for our Lifeboat Distribution segment for 2014 were $5.7 million compared to $4.7 million in 2013, mainly due to an increase in salaries on increased headcount to support
16
growth, and commissions compared to the prior year on higher segment gross profit. Total direct selling costs for our TechXtend segment for 2014 were $3.1 million compared to $3.3 million in 2013. The decrease in the TechXtend segment was due to lower commission and bonus expense resulting from lower segment gross profit.
The Company expects that its SG&A expenses, as a percentage of net sales, may vary depending on changes in sales volume, as well as the levels of continuing investments in key growth initiatives. We plan to continue to expand our investment in information technology and marketing, while monitoring our sales and general and administrative expenses closely.
Income Taxes
For the year ended December 31, 2014, the Company recorded a provision for income taxes of $3.0 million which consists of a provision of $2.7 million for U.S. federal income taxes, as well as a $0.1 million provision for state taxes, and a provision for foreign taxes of $0.2 million.
The current year effective tax rate was 34.2% compared to 32.1% in 2013. The current year effective tax rates are higher primarily due to the fact that the prior year included an adjustment to reflect a change in state apportionment rules.
As of December 31, 2014, the Company had a U.S. deferred tax asset of approximately $0.4 million.
For the year ended December 31, 2013, the Company recorded a provision for income taxes of $3.0 million which consists of a provision of $2.9 million for U.S. federal income taxes, as well as a $0.1 million provision for foreign taxes, and a deferred tax expense of $0.1 million
As of December 31, 2013, the Company had a U.S. deferred tax asset of approximately $0.4 million.
Year Ended December 31, 2013 Compared to Year Ended December 31, 2012
Net Sales
Net sales for 2013 increased 1%, or $3.3 million to $300.4 million in 2013 compared to $297.1 million in 2012. Total sales for our Lifeboat Distribution segment in 2013 were $237.7 million compared to $217.3 million in 2012, representing a 9% increase. Total sales for the TechXtend segment in 2013 amounted to $62.8 million, compared to $79.7 million in 2012, representing a 21% decrease.
The increase in net sales for our Lifeboat Distribution segment was mainly a result of the strengthening of our account penetration, our continued focus on the expanding virtual infrastructure-centric business and the addition of several key product lines; primarily on sales generated out of the USA sales office. The 21% decrease in sales in the TechXtend segment was primarily due to a decrease in large single sales transactions and a decrease in extended payment terms sales transactions in the first three quarters of 2013 as compared to exceptionally strong levels of large single sales transactions and extended payment terms sales transactions in 2012.
Gross Profit
Gross Profit for 2013 was $24.4 million compared to $23.9 million in 2012, a 2% increase. Total gross profit for our Lifeboat Distribution segment in 2013 was $17.4 million compared to $15.8 million in 2012, representing a 10% increase. The increase in gross profit for the Lifeboat Distribution segment was due to increased sales volume as gross profit margin remained relatively stable. Total gross profit for our TechXtend segment in 2013 was $6.9 million compared to $8.1 million in 2012, representing a 14% decrease. The decrease in gross profit for the TechXtend segment was the result primarily of decreased software sales volume, including a decrease in large single sale transactions and extended payment terms
17
sales transactions, offset in part by a higher gross margin in 2013 as compared to 2012 primarily on software sales. Vendor rebates and discounts for 2013 improved and amounted to $1.7 million compared to $1.5 million for 2012, representing a 13% increase. The increase in vendor rebates and discounts as a percentage of net sales was experienced mainly at the TechXtend segment.
Gross profit margin (gross profit as a percentage of net sales) for 2013 was 8.1% compared to 8.0% in 2012. Gross profit margin for our Lifeboat Distribution segment was consistent at 7.3% in 2013 and 2012. Gross profit margin for our TechXtend segment in 2013 was 11.0% compared to 10.1% in 2012. This increase is due to increased pricing and vendor rebates in 2013 as compared to 2012.
The increase in gross profit dollars and the increase in gross profit margins were primarily caused by the sales growth within our Lifeboat Distribution segment and increase in pricing and an increase in rebates earned at our TechXtend segment.
The Company monitors gross profits and gross profit margins carefully. Price competition in our market persisted in 2013. Although our total gross profit margins improved slightly in 2013, we anticipate that margins, as well as discounts and rebates, will continue to be under pressure in the near future.
Selling, General and Administrative Expenses
Total selling, general and administrative (“SG&A”) expenses for 2013 were $15.5 million compared to $15.4 million in 2012, representing an increase of $0.1 million or 0.8%. This increase is primarily the result of an increase in sales commissions and bonus for our Lifeboat segment due to our growth in this segment, increase in operations bonus, the addition of employees in TechXtend government sales, finance and operations to support business growth offset by a decrease in TechXtend sales commissions and bonus due to decrease in this segment and a decrease in legal and consulting fees. SG&A expenses as a percentage of net sales were 5.2% in each of 2013 and 2012.
Direct selling costs (a component of SG&A) for 2013 were $8.0 million compared to $8.1 million in 2012. Total direct selling costs for our Lifeboat Distribution segment for 2013 were $4.7 million compared to $4.5 million in 2012, mainly due to increased commission and bonus expense compared to the prior year on higher segment gross profit and income. Total direct selling costs for our TechXtend segment for 2013 were $3.3 million compared to $3.6 million in 2012. The decrease in the TechXtend segment was due to lower commission and bonus expense resulting from lower segment gross profit and segment income which are the bases for calculating commission and bonus expense offset by an increase in government sales salaries.
The Company expects that its SG&A expenses, as a percentage of net sales, may vary depending on changes in sales volume, as well as the levels of continuing investments in key growth initiatives. We plan to continue to expand our investment in information technology and marketing, while monitoring our sales and general and administrative expenses closely.
Income Taxes
For the year ended December 31, 2013, the Company recorded a provision for income taxes of $3.0 million which consists of a provision of $2.9 million for U.S. federal income taxes, as well as a $0.1 million provision for foreign taxes, and a deferred tax expense of $0.1 million.
The current year effective tax rate was 32.1% compared to 39.6% in 2012. The decrease in the effective tax rate was primarily the result of a change in the state of New Jersey’s apportionment rules which lowered our state rate compared with the prior year.
As of December 31, 2013, the Company had a U.S. deferred tax asset of approximately $0.4 million.
18
For the year ended December 31, 2012, the Company recorded a provision for income taxes of $3.6 million which consists of a provision of $2.8 million for U.S. federal income taxes, as well as a $0.5 million provision for state and local taxes, a $0.2 million provision for foreign taxes, and a deferred tax expense of $0.1 million.
As of December 31, 2012, the Company had a U.S. deferred tax asset of approximately $0.5 million.
Recently Issued Accounting Pronouncements
In May 2014, the FASB issued guidance for revenue recognition for contracts, superseding the previous revenue recognition requirements, along with most existing industry-specific guidance. The guidance requires an entity to review contracts in five steps: 1) identify the contract, 2) identify performance obligations, 3) determine the transaction price, 4) allocate the transaction price, and 5) recognize revenue. The new standard will result in enhanced disclosures regarding the nature, amount, timing and uncertainty of revenue arising from contracts with customers. The standard is effective for our reporting year beginning January 1, 2017 and early adoption is not permitted. We are currently evaluating the impact of this new accounting pronouncement, if any; the pronouncement will have on our consolidated financial statements.
Liquidity and Capital Resources
Our cash and cash equivalents increased by $3.5 million to $23.1 million at December 31, 2014 from $19.6 million at December 31, 2013. Net cash provided by operating activities amounted to $5.7 million, net cash used in investing activities amounted to $0.3 million, and net cash used in financing activities amounted to $1.5 million.
Net cash provided by operating activities in 2014 was $5.7 million. In 2014, cash was mainly provided by $7.4 million from net income including non-cash charges, a $1.7 million decrease in accounts receivable, and a $1.2 million decrease in prepaid and other current assets, offset in part by a decrease in accounts payable and accrued expenses of $4.3 million.
In 2014, net cash used in investing activities was $0.3 million. This resulted primarily from $0.3 million for the purchase of equipment and leasehold improvements.
Net cash used in financing activities in 2014 of $1.5 million consisted of $3.2 million of dividend payments on our Common Stock and $0.8 million for the purchases of treasury shares of our Common Stock offset by the tax benefit from share based compensation of $0.7 million and the exercise of stock options of $1.8 million.
In 2014 the Board of Directors authorized the purchase of 500,000 shares of our Common Stock. In 2008, the Board of Directors authorized the purchase of 500,000 shares of our Common Stock. In 2002, the Board of Directors authorized the purchase of 1,490,000 shares of our Common Stock. In October 1999, the Company was authorized by the Board of Directors to buy back 521,013 shares of our Common Stock in both open market and private transactions, as conditions warrant. A total of 2,307,066 shares of the Company’s stock had been bought back as of December 31, 2014 leaving a balance of 703,947 shares of Common Stock that the Company is authorized to buy back in the future.
The Company’s Rule 10b5-1 plan (the “ 2012 10b5-1 plan”) which became effective on October 29, 2012, terminated by its own terms on October 29, 2014. Accordingly no further purchases of the Company’s Common Stock may be effected under its 2012 10b5-1.
19
On October 29, 2014, the Board of Directors approved, and on November 10, 2014, the Company entered into a written purchase plan intended to comply with the requirements of Rule 10b5-1 under the Exchange Act, as amended (the “Plan”). Purchases involving shares of the Company’s Common Stock under the Plan commenced November 10, 2014, and the Plan is intended to be in effect until May 10, 2015. Pursuant to the Plan, the Company’s broker shall effect purchases of up to an aggregate of 210,000 shares of Common Stock.
We intend to hold the repurchased shares in treasury for general corporate purposes, including issuances under various stock plans. As of December 31, 2014, we held 393,744 shares of our Common Stock in treasury at an average cost of $15.66 per share. As of December 31, 2013, we held 631,207 shares of our Common Stock in treasury at an average cost of $11.12 per share.
The Company’s current and anticipated use of its cash and cash equivalents is, and will continue to be, to fund working capital, operational expenditures, the stock repurchase program and dividends, if any, declared by the Board of Directors.
On January 4, 2013, the Company entered into a $10,000,000 revolving credit facility (the “Credit Facility”) with Citibank, N.A. pursuant to a Business Loan Agreement, Promissory Note, Commercial Security Agreements and Commercial Pledge Agreement. The Credit Facility, which will be used for business and working capital purposes, including financing of larger extended payment terms sales transactions which may become a more significant portion of the Company’s net sales. The Credit Facility matures on January 4, 2016. (see Note 5 Credit Facility in the Notes to our Consolidated Financial Statements). As of December 31, 2014 there were no borrowings outstanding on the Credit Facility.
The Company believes that the cash flows from operations and funds held in cash and cash equivalents as well as available borrowing on the Credit Facility will be sufficient to fund the Company’s working capital and cash requirements for at least the next 12 months.
The Company had cash and cash equivalents of $23.1 million as of December 31, 2014, of which $3.2 million was held outside the United States. Our current intention is to reinvest the majority of our earnings from foreign operations. Our current plans do not anticipate a need to repatriate cash to fund our domestic operations. In the event cash from foreign operations is needed to fund operations in the U.S., we would be subject to additional income taxes in the U.S. reduced by any foreign taxes paid on these earnings.
Contractual Obligations as of December 31, 2014
(Amounts in thousands)
Payment due by Period
|
|
|
Total |
|
Less than 1 year |
|
1-3 years |
|
4-5 years |
|
After 5 years |
|
|
Long-term debt obligations |
|
— |
|
— |
|
— |
|
— |
|
— |
|
|
Capital Lease obligations |
|
— |
|
— |
|
— |
|
— |
|
|
|
|
Operating Leases obligations (1) |
|
$ |
494 |
|
$ |
325 |
|
$ |
169 |
|
— |
|
— |
|
|
Purchase Obligations |
|
— |
|
— |
|
— |
|
— |
|
— |
|
|
Other Long term Obligations reflected on the Company’s Balance Sheet under GAAP |
|
— |
|
— |
|
— |
|
— |
|
— |
|
|
Total Contractual Obligations |
|
$ |
497 |
|
$ |
328 |
|
$ |
169 |
|
— |
|
— |
|
(1) Operating leases relate primarily to the lease of the space used for our operations in Shrewsbury and Eatontown, New Jersey, Mississauga, Canada and Almere, Netherlands. The commitments for operating leases include the minimum rent payments.
As of December 31, 2014, the Company is not committed by lines of credit or standby letters of credit, and has no standby repurchase obligations or other commercial commitments (see Note 5 Credit Facility in the Notes to our Consolidated Financial Statements).
20
Foreign Exchange
The Company’s Canadian business is subject to changes in demand or pricing resulting from fluctuations in currency exchange rates or other factors. We are subject to fluctuations primarily in the Canadian Dollar-to-U.S. Dollar exchange rate.
Off-Balance Sheet Arrangements
As of December 31, 2014, we did not have any off-balance sheet arrangements, as defined in Item 303 (a)(4)(ii) of SEC Regulation S-K.
Critical Accounting Policies and Estimates
Management’s discussion and analysis of the Company’s financial condition and results of operations are based upon the Company’s consolidated financial statements that have been prepared in accordance with US GAAP. The preparation of these financial statements requires the Company to make estimates and judgments that affect the reported amounts of assets, liabilities, revenues and expenses, and related disclosure of contingent assets and liabilities. The Company recognizes revenue from the sale of software and hardware for microcomputers, servers and networks on a gross revenue recognition basis upon shipment or upon electronic delivery of the product.
On an on-going basis, the Company evaluates its estimates, including those related to product returns, bad debts, inventories, investments, intangible assets, income taxes, stock-based compensation, contingencies and litigation.
The Company bases its estimates on historical experience and on various other assumptions that are believed to be reasonable under the circumstances, the results of which form the basis for making judgments about the carrying values of assets and liabilities that are not readily apparent from other sources. Actual results may differ from these estimates.
The Company believes the following critical accounting policies used in the preparation of its consolidated financial statements affect its more significant judgments and estimates.
The Company maintains allowances for doubtful accounts for estimated losses resulting from the inability of its customers to make required payments. If the financial condition of the Company’s customers were to deteriorate, resulting in an impairment of their ability to make payments, additional allowances may be required.
The Company writes down its inventory for estimated obsolescence or unmarketable inventory equal to the difference between the cost of inventory and the estimated market value based upon assumptions about future demand and market conditions. If actual market conditions are less favorable than those projected by management, additional inventory write-offs may be required.
The Company has considered future taxable income and ongoing prudent and feasible tax planning strategies in assessing the need for the valuation allowance related to deferred tax assets. In the event the Company were to determine that it would not be able to realize all or part of its net deferred tax assets in the future, an adjustment to the deferred tax assets would be charged to income in the period such determination was made.
21
Under the fair value recognition provision, stock-based compensation cost is measured at the grant date based on the fair value of the award and is recognized as expense on a straight-line basis over the requisite service period, which is the vesting period. We make certain assumptions in order to value and expense our various share-based payment awards. In connection with valuing stock options, we use the Black-Scholes model, which requires us to estimate certain subjective assumptions. The key assumptions we make are: the expected volatility of our stock; the expected term of the award; and the expected forfeiture rate. In connection with our restricted stock programs we make assumptions principally related to the forfeiture rate. We review our valuation assumptions periodically and, as a result, we may change our valuation assumptions used to value stock based awards granted in future periods. Such changes may lead to a significant change in the expense we recognize in connection with share-based payments.
Item 7A. Quantitative and Qualitative Disclosures about Market Risk
In addition to its activities in the USA, 7% of the Company’s 2014 sales were generated in Canada. We are subject to general risks attendant to the conduct of business in Canada, including economic uncertainties and foreign government regulations. In addition, the Company’s Canadian business is subject to changes in demand or pricing resulting from fluctuations in currency exchange rates or other factors.
The Company’s cash and cash equivalents, at times, may exceed federally insured limits. The Company maintains its cash accounts primarily in financial institutions with global operations. The Company has not experienced any losses in such accounts. The Company believes it is not exposed to any significant credit risk on cash and cash equivalents.
Item 8. Financial Statements and Supplementary Data
See Index to Consolidated Financial Statements at Item 15(a).
Item 9. Changes in and Disagreements with Accountants on Accounting and Financial Disclosure
None.
Item 9A. Controls and Procedures
Evaluation of Disclosure Controls and Procedures. As required by Rule 13a-15(b) under the Exchange Act, our management carried out an evaluation of the effectiveness of the design and operation of the Company’s “disclosure controls and procedures”, as such term is defined in Rules 13a-15(e) and 15d-15(e) under the Exchange Act, as of the end of the period covered by this report. This evaluation was carried out under the supervision and with the participation of our management, including our Company’s President, Chairman of the Board and Chief Executive Officer (principal executive officer) and Vice President and Chief Accounting Officer (principal financial officer). Based upon that evaluation, the Company’s Chief Executive Officer and Chief Accounting Officer concluded that the Company’s disclosure controls and procedures were effective, as of the end of the period covered by this report, to ensure that information required to be disclosed by the Company in the reports it files or submits under the Exchange Act is recorded, processed, summarized and reported within the time periods specified in the SEC’s rules and forms and is accumulated and communicated to the Company’s management, including the Company’s Chief Executive Officer and Interim Chief Accounting Officer, as appropriate, to allow timely decisions regarding required disclosure.
Management Report on Internal Control Over Financial Reporting. Our management is responsible for establishing and maintaining adequate internal control over financial reporting as defined in
22
Rules 13a-15(f) and 15d-15(f) of the Exchange Act. Internal control over financial reporting is a process designed by, or under the supervision of, our Chief Executive Officer and Chief Accounting Officer, and effected by the Board of Directors, management and other personnel, to provide reasonable assurance regarding the reliability of our financial reporting and the preparation of financial statements for external purposes in accordance with GAAP. Internal control over financial reporting includes maintaining records in reasonable detail that accurately and fairly reflect our transactions and disposition of assets; providing reasonable assurance that transactions are recorded as necessary for preparation of our financial statements in accordance with GAAP; providing reasonable assurance that receipts and expenditures of the Company, are made in accordance of with authorizations of management and directors of the Company; and providing reasonable assurance that unauthorized acquisition, use or disposition of Company assets that could have a material effect on our financial statements would be prevented or detected on a timely basis. Because of its inherent limitations, internal control over financial reporting is not intended to provide absolute assurance that a misstatement of our financial statements would be prevented or detected. In addition, projections of any evaluation of effectiveness to future periods are subject to the risk that, owing to changes in conditions, controls may become inadequate, or that the degree of compliance with policies or procedures may deteriorate.
Management, with the participation of our Chief Executive Officer and Chief Accounting Officer, conducted an evaluation of the effectiveness of our internal control over financial reporting based on the framework in Internal Control — Integrated Framework issued by the Committee of Sponsoring Organizations of the Treadway Commission ( 2013 Framework). Based on this evaluation, management concluded that the Company’s internal control over financial reporting was effective as of December 31, 2014. There were no changes in our internal control over financial reporting during the quarter ended December 31, 2014 that have materially affected, or are reasonably likely to materially affect, our internal control over financial reporting.
This annual report does not include an attestation report of the Company’s registered public accounting firm regarding internal control over financial reporting. Management’s report was not subject to attestation by the Company’s registered public accounting firm.
Item 9B. Other Information
None.
PART III
Item 10. Directors, Executive Officers and Corporate Governance
The information required hereunder, with the exception of the information relating to the executive officers of the Registrant that is presented in Part I under the heading “Executive Officers of the Company,” and the information relating to the Company’s Code of Ethical Conduct that is presented in Part I under the heading “Available Information,” is incorporated by reference herein from our Definitive Proxy Statement for the 2015 Annual Meeting of Stockholders, to be filed pursuant to Regulation 14A not later than April 30, 2015 (the “Definitive Proxy Statement”) under the sections captioned “Election of Directors,” “Corporate Governance” and “Section 16 (a) Beneficial Ownership Reporting Compliance.”
Item 11. Executive Compensation
The information required hereunder is incorporated by reference herein from the Definitive Proxy Statement under the sections captioned “Executives and Executive Compensation” and “Corporate Governance.”
23
Item 12. Security Ownership of Certain Beneficial Owners and Management and Related Stockholder Matters
The information required hereunder is incorporated by reference herein from the Definitive Proxy Statement under the sections captioned “Equity Compensation Plan Information — Securities Authorized for Issuance under Equity Compensation Plans” and “Security Ownership of Certain Beneficial Owners and Management”.
24
Item 13. Certain Relationships and Related Party Transactions, and Director Independence
The information required hereunder is incorporated by reference herein from the Definitive Proxy Statement under the sections captioned “Executives and Executive Compensation,” “Corporate Governance” and “Transactions with Related Persons.”
Item 14. Principal Accounting Fees and Services
The information required hereunder is incorporated by reference herein from the Definitive Proxy Statement under the section captioned “Ratification of Appointment of Independent Registered Public Accounting Firm”.
PART IV
Item 15. Exhibits, Financial Statement Schedules
(a) The following documents are filed as part of this Report:
1. Consolidated Financial Statements (See Index to Consolidated Financial Statements on page F-1 of this report);
2. Financial Statement Schedule:
Schedule II Valuation and Qualifying Accounts
All other schedules are omitted since the required information is not present or is not present in amounts sufficient to require submission of the schedule, or because the information required is included in the consolidated financial statements or notes thereto.
3. Exhibits Required by Regulation S-K, Item 601:
|
Exhibit No. |
|
Description of Exhibit |
|
|
|
|
|
3.1 |
|
Form of Amended and Restated Certificate of Incorporation of the Company. (1) |
|
|
|
|
|
3.1(a) |
|
Certificate of Amendment of Restated Certificate of Incorporation of the Company. (2) |
|
|
|
|
|
3.2 |
|
Form of Amended and Restated By-Laws of the Company.(1) |
|
|
|
|
|
4.1 |
|
Specimen of Common Stock Certificate.(1) |
|
|
|
|
|
10.1 |
|
Business Loan Agreement, dated January 4, 2013, between Wayside Technology Group,Inc., Lifeboat Distribution, Inc., TechXtend, Inc., Programmer’s Paradise, Inc., asborrowers, and Citibank, N.A., as lender. (16) |
|
|
|
|
|
10.2 |
|
Promissory Note, dated January 4, 2013, between Wayside Technology Group, Inc., Lifeboat Distribution, Inc., Techxtend, Inc., Programmer’s Paradise, Inc., as borrowers, and Citibank, N.A., as lender. (16) |
|
|
|
|
|
10.3 |
|
Commercial Pledge Agreement, dated January 4, 2013, among Wayside Technology Group, Inc., as grantor, Wayside Technology Group, Inc., Lifeboat Distribution, Inc., Techxtend, Inc., Programmer’s Paradise, Inc., as borrowers, and Citibank, N.A., as lender. (16) |
|
|
|
|
|
10.4 |
|
Commercial Security Agreement, dated January 4, 2013, among Wayside Technology Group, Inc., as grantor, Wayside Technology Group, Inc., Lifeboat Distribution, Inc., |
25
|
|
|
Techxtend, Inc., Programmer’s Paradise, Inc., as borrowers, and Citibank, N.A., as lender. (16) |
|
|
|
|
|
10.5 |
|
Commercial Security Agreement, dated January 4, 2013, among Lifeboat Distribution, Inc., as grantor, Wayside Technology Group, Inc., Lifeboat Distribution, Inc., Techxtend, Inc., Programmer’s Paradise, Inc., as borrowers, and Citibank, N.A., as lender. (16) |
|
|
|
|
|
10.6 |
|
Commercial Security Agreement, dated January 4, 2013, among Programmer’s Paradise, Inc., as grantor, Wayside Technology Group, Inc., Lifeboat Distribution, Inc., Techxtend, Inc., Programmer’s Paradise, Inc., as borrowers, and Citibank, N.A., as lender. (16) |
|
|
|
|
|
10.7 |
|
Commercial Security Agreement, dated January 4, 2013, among Techxtend, Inc., as grantor, Wayside Technology Group, Inc., Lifeboat Distribution, Inc., Techxtend, Inc., Programmer’s Paradise, Inc., as borrowers, and Citibank, N.A., as lender. (16) |
|
|
|
|
|
10.8 |
|
1995 Stock Plan, as amended. (3) |
|
|
|
|
|
10.9 |
|
1995 Non-Employee Director Plan, as amended. (3) |
|
|
|
|
|
10.9(a) |
|
2006 Stock-Based Compensation Plan. (4) |
|
|
|
|
|
10.9(b) |
|
First Amendment to 2006 Stock-Based Compensation Plan. (5) |
|
|
|
|
|
10.9(c) |
|
Second Amendment to 2006 Stock-Based Compensation Plan. (5) |
|
|
|
|
|
10.10 |
|
Form of Officer and Director Indemnification Agreement. (1) |
|
|
|
|
|
10.11 |
|
2012 Stock-Based Compensation Plan (15) |
|
|
|
|
|
10.12 |
|
Lease dated as of May 14, 1997 between Robert C. Baker, et al as Landlord and the Company. (6) |
|
|
|
|
|
10.12(a) |
|
Modification of Lease, dated as of July 27, 2006, between SBC Holdings, L.P. (successor in interest to Robert C. Baker, et al.) and the Company. (2) |
|
|
|
|
|
10.13 |
|
Employment Agreement, dated January 12, 2006, between the Company and Simon F. Nynens. (7) |
|
|
|
|
|
10.14 |
|
Offer Letter, dated January 6, 2003, from the Company to Vito Legrottaglie.(8) |
|
|
|
|
|
10.15 |
|
Resignation Letter, dated May 16, 2007, from Wayside Technology Group, Inc. to Jeffrey Largiader. (9) |
|
|
|
|
|
10.16 |
|
General Release, dated May 18, 2007, between Jeffrey Largiader and Wayside Technology Group, Inc. (5) |
|
|
|
|
|
10.17 |
|
Restricted Stock Letter, dated August 15, 2006, between Vito Legrottaglie and Wayside Technology Group, Inc (f/k/a Programmer’s Paradise Inc.). (5) |
|
|
|
|
|
10.18 |
|
Restricted Stock Letter, dated August 15, 2006, between Jeffrey Largiader and Wayside Technology Group, Inc (f/k/a Programmer’s Paradise Inc.). (5) |
|
|
|
|
|
10.19 |
|
Restricted Stock Letter, dated August 15, 2006, between Daniel Jamieson and Wayside Technology Group, Inc (f/k/a Programmer’s Paradise Inc.). (5) |
26
|
10.20 |
|
Restricted Stock Letter, dated August 15, 2006, between Allan Weingarten and Wayside Technology Group, Inc (f/k/a Programmer’s Paradise Inc.). (5) |
|
|
|
|
|
10.21 |
|
Restricted Stock Letter, dated August 15, 2006, between Edwin Morgens and Wayside Technology Group, Inc (f/k/a Programmer’s Paradise Inc.). (5) |
|
|
|
|
|
10.22 |
|
Restricted Stock Letter, dated August 15, 2006, between Duff Meyercord and Wayside Technology Group, Inc (f/k/a Programmer’s Paradise Inc.). (5) |
|
|
|
|
|
10.23 |
|
Restricted Stock Letter, dated August 15, 2006, between Simon F. Nynens and Wayside Technology Group, Inc (f/k/a Programmer’s Paradise Inc.). (5) |
|
|
|
|
|
10.24 |
|
Restricted Stock Letter, dated August 15, 2006, between Simon F. Nynens and Wayside Technology Group, Inc (f/k/a Programmer’s Paradise Inc.). (5) |
|
|
|
|
|
10.25 |
|
Restricted Stock Letter, dated August 15, 2006, between Kevin Scull and Wayside Technology Group, Inc (f/k/a Programmer’s Paradise Inc.). (5) |
|
|
|
|
|
10.26 |
|
Restricted Stock Letter, dated January 31, 2007, between William Willett and Wayside Technology Group, Inc (f/k/a Programmer’s Paradise Inc.). (5) |
|
|
|
|
|
10.27 |
|
Restricted Stock Letter, dated November 19, 2007, between Richard Bevis and Wayside Technology Group, Inc (f/k/a Programmer’s Paradise Inc.). (5) |
|
|
|
|
|
10.28 |
|
Form of Non-Qualified Stock Option Agreement. (5) |
|
|
|
|
|
10.29 |
|
Restricted Stock Letter, dated February 5, 2008, between Kevin Scull and Wayside Technology Group, Inc. (10) |
|
|
|
|
|
10.30 |
|
Restricted Stock Letter, dated February 5, 2008, between Richard Bevis and Wayside Technology Group, Inc. (10) |
|
|
|
|
|
10.31 |
|
Restricted Stock Letter, dated February 5, 2008, between Simon Nynens and Wayside Technology Group, Inc. (10) |
|
|
|
|
|
10.32 |
|
Restricted Stock Letter, dated February 5, 2008, between Vito Legrottaglie and Wayside Technology Group, Inc. (10) |
|
|
|
|
|
10.33 |
|
Restricted Stock Letter, dated February 5, 2008, between Daniel Jamieson and Wayside Technology Group, Inc. (10) |
|
|
|
|
|
10.34 |
|
Restricted Stock Letter, dated February 5, 2008, between Edwin Morgens and Wayside Technology Group, Inc. (10) |
|
|
|
|
|
10.35 |
|
Restricted Stock Letter, dated February 5, 2008, between William Willett and Wayside Technology Group, Inc. (10) |
|
|
|
|
|
10.36 |
|
Restricted Stock Letter, dated February 5, 2008, between Allan Weingarten and Wayside Technology Group, Inc. (10) |
|
|
|
|
|
10.37 |
|
Restricted Stock Letter, dated February 5, 2008, between Mark Boyer and Wayside Technology Group, Inc. (10) |
|
|
|
|
|
10.38 |
|
Restricted Stock Letter, dated February 5, 2008, between Duff Meyercord and Wayside Technology Group, Inc. (10) |
27
|
10.39 |
|
Restricted Stock Letter, dated May 5, 2009, between Simon Nynens and Wayside Technology Group, Inc. (11) |
|
|
|
|
|
10.40 |
|
Restricted Stock Letter, dated May 5, 2009, between Kevin Scull and Wayside Technology Group, Inc. (11) |
|
|
|
|
|
10.41 |
|
Restricted Stock Letter, dated May 5, 2009, between Richard Bevis and Wayside Technology Group, Inc. (11) |
|
|
|
|
|
10.42 |
|
Restricted Stock Letter, dated May 5, 2009, between Shawn Giordano and Wayside Technology Group, Inc. (11) |
|
|
|
|
|
10.43 |
|
Restricted Stock Letter, dated May 5, 2009, between Daniel Jamieson and Wayside Technology Group, Inc. (11) |
|
|
|
|
|
10.44 |
|
Restricted Stock Letter, dated May 5, 2009, between Vito Legrottaglie and Wayside Technology Group, Inc. (11) |
|
|
|
|
|
10.45 |
|
Restricted Stock Letter, dated February 9, 2010, between Kevin Scull and Wayside Technology Group, Inc. (12) |
|
|
|
|
|
10.46 |
|
Restricted Stock Letter, dated February 9, 2010, between Richard Bevis and Wayside Technology Group, Inc. (12) |
|
|
|
|
|
10.47 |
|
Restricted Stock Letter, dated February 9, 2010, between Simon Nynens and Wayside Technology Group, Inc. (12) |
|
|
|
|
|
10.48 |
|
Restricted Stock Letter, dated February 9, 2010, between Vito Legrottaglie and Wayside Technology Group, Inc. (12) |
|
|
|
|
|
10.49 |
|
Restricted Stock Letter, dated February 9, 2010, between Daniel Jamieson and Wayside Technology Group, Inc. (12) |
|
|
|
|
|
10.50 |
|
Restricted Stock Letter, dated February 9, 2010, between Shawn Giordano and Wayside Technology Group, Inc. (12) |
|
|
|
|
|
10.51 |
|
Restricted Stock Letter, dated February 9, 2010, between Edwin Morgens and Wayside Technology Group, Inc. (12) |
|
|
|
|
|
10.52 |
|
Restricted Stock Letter, dated February 9, 2010, between William Willett and Wayside Technology Group, Inc. (12) |
|
|
|
|
|
10.53 |
|
Restricted Stock Letter, dated February 9, 2010, between Allan Weingarten and Wayside Technology Group, Inc. (12) |
|
|
|
|
|
10.54 |
|
Restricted Stock Letter, dated February 9, 2010, between Mark Boyer and Wayside Technology Group, Inc. (12) |
|
|
|
|
|
10.55 |
|
Restricted Stock Letter, dated February 9, 2010, between Duff Meyercord and Wayside Technology Group, Inc. (12) |
|
|
|
|
|
10.56 |
|
Restricted Stock Letter, dated June 6, 2012, between Mike Faith and Wayside Technology Group, Inc. (13) |
|
|
|
|
|
10.57 |
|
Restricted Stock Letter, dated May 8, 2012, between Dan Jamieson and Wayside Technology Group, Inc. (13) |
28
|
10.58 |
|
Restricted Stock Letter, dated May 8, 2012, between Shawn Giordano and Wayside Technology Group, Inc. (13) |
|
|
|
|
|
10.59 |
|
Restricted Stock Letter, dated May 8, 2012, between Vito Legrottaglie and Wayside Technology Group, Inc. (13) |
|
|
|
|
|
10.60 |
|
Restricted Stock Letter, dated December 10, 2012, between Thomas Flaherty and Wayside Technology Group, Inc.(13) |
|
|
|
|
|
10.61 |
|
Restricted Stock Letter, dated February 5, 2013, between Simon F. Nynens and Wayside Technology Group, Inc.(14) |
|
|
|
|
|
21.1 |
|
Subsidiaries of the Registrant |
|
|
|
|
|
23.1 |
|
Consent of EisnerAmper LLP |
|
|
|
|
|
31.1 |
|
Certification pursuant to Rule 13a-14(a) or Rule 15d-14(a) of the Securities Exchange Act of 1934, of Simon F. Nynens, the Chief Executive Officer of the Company. |
|
|
|
|
|
31.2 |
|
Certification pursuant to Rule 13a-14(a) or Rule 15d-14(a) of the Securities Exchange Act of 1934, of Kevin T. Scull, the Vice President and Chief Accounting Officer of the Company. |
|
|
|
|
|
32.1 |
|
Certification pursuant to Rule 13a-14(b) of the Securities Exchange Act of 1934 and 18 U.S.C. Section 1350, as adopted pursuant to Section 906 of the Sarbanes-Oxley Act of 2002, of Simon F. Nynens, the Chief Executive Officer of the Company.(17) |
|
|
|
|
|
32.2 |
|
Certification pursuant to Rule 13a-14(b) of the Securities Exchange Act of 1934 and 18 U.S.C. Section 1350, as adopted pursuant to Section 906 of the Sarbanes-Oxley Act of 2002, of Kevin T. Scull, the Vice President and Chief Accounting Officer of the Company.(17) |
|
|
|
|
|
101 |
|
The following financial information from Wayside Technology Group, Inc.’s Annual Report on Form 10-K for the year ended December 31, 2014, filed with the SEC on February 20, 2015, formatted in XBRL (Extensible Business Reporting Language) includes: (1) Consolidated Balance Sheets, (2) Consolidated Statements of Earnings, (3) Consolidated Statements of Comprehensive Income, (4) Consolidated Statements of Stockholders’ Equity, (5) Consolidated Statements of Cash Flows, and (6) the Notes to the Consolidated Financial Statements. |
29
|
(1) |
|
Incorporated by reference to the Exhibits of the same number to the Registrant’s Registration Statement on Form S-1 or amendments thereto (File No. 333-92810). |
|
|
|
|
|
(2) |
|
Incorporated by reference to the Exhibits of the same number to the Registrant’s Quarterly Report on Form 10-Q for the quarter ended September 30, 2006 filed on November 3, 2006. |
|
|
|
|
|
(3) |
|
Incorporated by reference to Exhibit A and Exhibit B, respectively, to the Registrant’s Definitive Annual Meeting Proxy Statement filed on April 30, 1998. |
|
|
|
|
|
(4) |
|
Incorporated by reference to Exhibit A of the Registrant’s Definitive Annual Meeting Proxy Statement filed on April 28, 2006. |
|
|
|
|
|
(5) |
|
Incorporated by reference to exhibits of the same number filed with the Registrant’s Annual Report on Form 10-K for the year ended December 31, 2007 filed on March 13, 2008. |
|
|
|
|
|
(6) |
|
Incorporated by reference to Exhibit 10.42 of the Registrant’s Annual Report on Form 10-K for the year ended December 31, 1998 filed on March 31, 1999. |
|
|
|
|
|
(7) |
|
Incorporated by reference to Exhibit 10.43 to the Registrant’s Quarterly Report on Form 10-Q for the quarter ended March 31, 2006 filed on May 12, 2006. |
|
|
|
|
|
(8) |
|
Incorporated by reference to exhibits of the same number filed with the Registrant’s Quarterly Report on Form 10-Q for the quarter ended March 31, 2007 filed on May 15, 2007. |
|
|
|
|
|
(9) |
|
Incorporated by reference to exhibits of the same number filed with the Registrant’s Current Report on Form 8-K filed on May 21, 2007. |
|
|
|
|
|
(10) |
|
Incorporated by reference to exhibits of the same number filed with the Registrant’s Quarterly Report on Form 10-Q for the Period Ended March 31, 2008 filed May 12, 2008. |
|
|
|
|
|
(11) |
|
Incorporated by reference to exhibits of the same number filed with the Registrant’s Quarterly Report on Form 10-Q for the Period Ended June 30, 2009 filed August 11, 2009. |
|
|
|
|
|
(12) |
|
Incorporated by reference to exhibits of the same number filed with the Registrant’s Quarterly Report on Form 10-Q for the Period Ended March 31, 2010 filed May 10, 2010. |
|
|
|
|
|
(13) |
|
Incorporated by reference to exhibits of the same number filed with the Registrant’s Annual Report on Form 10-K for the Period Ended December 31, 2012 filed February 15, 2013. |
|
|
|
|
|
(14) |
|
Incorporated by reference to exhibits of the same number filed with the Registrant’s Quarterly Report on Form 10-Q for the Period Ended March 31, 2013 filed May 1, 2013. |
|
|
|
|
|
(15) |
|
Incorporated by reference to Exhibit A of the Registrant’s Definitive Annual Meeting Proxy Statement filed on April 24, 2012. |
|
|
|
|
|
(16) |
|
Incorporated by reference to the Registrant’s Form 8-K filed on January 8, 2013. |
|
|
|
|
|
(17) |
|
Furnished herewith. |
|
|
|
|
|
(b) The exhibits required by Item 601 of Regulation S-K are reflected above in Section (a) 3.of this Item. |
|
|
|
(c) The financial statement schedule is included as reflected in Section (a) 2.of this Item. |
30
SIGNATURES
Pursuant to the requirements of Section 13 or 15(d) of the Securities Exchange Act of 1934, the Registrant has duly caused this report to be signed on its behalf by the undersigned thereunto duly authorized, in Shrewsbury, New Jersey, on February 20, 2015.
|
|
WAYSIDE TECHNOLOGY GROUP, INC. |
|
|
|
|
|
|
|
|
By: |
/s/ Simon F. Nynens |
|
|
|
Simon F. Nynens, President and |
|
|
|
Chief Executive Officer |
Pursuant to the requirements of the Securities Exchange Act of 1934, this report has been signed below by the following persons on behalf of the Registrant in the capacities and on the dates indicated:
|
Signature |
|
Title |
|
Date |
|
|
|
|
|
|
|
|
|
President, Chief Executive Officer and |
|
February 20, 2015 |
|
/s/ Simon F. Nynens |
|
Chairman of the Board of Directors |
|
|
|
Simon F. Nynens |
|
(Principal Executive Officer) |
|
|
|
|
|
|
|
|
|
/s/ Kevin T. Scull |
|
Vice President and |
|
February 20, 2015 |
|
Kevin T. Scull |
|
Chief Accounting Officer |
|
|
|
|
|
(Principal Financial and Accounting Officer) |
|
|
|
|
|
|
|
|
|
/s/ Mark T. Boyer |
|
Director |
|
February 20, 2015 |
|
Mark. T. Boyer |
|
|
|
|
|
|
|
|
|
|
|
/s/ Duffield Meyercord |
|
Director |
|
February 20, 2015 |
|
Duffield Meyercord |
|
|
|
|
|
|
|
|
|
|
|
/s/ Allan D. Weingarten |
|
Director |
|
February 20, 2015 |
|
Allan D. Weingarten |
|
|
|
|
|
|
|
|
|
|
|
/s/ Mike Faith |
|
Director |
|
February 20, 2015 |
|
Mike Faith |
|
|
|
|
|
|
|
|
|
|
|
/s/ Steven DeWindt |
|
Director |
|
February 20, 2015 |
|
Steven DeWindt |
|
|
|
|
31
Items 8 and 15(a)
Wayside Technology Group, Inc. and Subsidiaries
Index to Consolidated Financial Statements and Schedule
F-1
Report of Independent Registered Public Accounting Firm
The Board of Directors and Stockholders
Wayside Technology Group, Inc. and Subsidiaries
We have audited the accompanying consolidated balance sheets of Wayside Technology Group, Inc. and Subsidiaries as of December 31, 2014 and 2013, and the related consolidated statements of earnings, comprehensive income, stockholders’ equity, and cash flows for each of the years in the three-year period ended December 31, 2014. These financial statements are the responsibility of the Company’s management. Our responsibility is to express an opinion on these financial statements based on our audits.
We conducted our audits in accordance with the standards of the Public Company Accounting Oversight Board (United States). Those standards require that we plan and perform the audit to obtain reasonable assurance about whether the financial statements are free of material misstatement. The Company is not required to have, nor were we engaged to perform, an audit of its internal control over financial reporting. Our audit included consideration of internal control over financial reporting as a basis for designing audit procedures that are appropriate in the circumstances, but not for the purpose of expressing an opinion on the effectiveness of the Company’s internal control over financial reporting. Accordingly, we express no such opinion. An audit also includes examining, on a test basis, evidence supporting the amounts and disclosures in the financial statements, assessing the accounting principles used and significant estimates made by management, as well as evaluating the overall financial statement presentation. We believe that our audits provide a reasonable basis for our opinion.
In our opinion, the consolidated financial statements referred to above present fairly, in all material respects, the consolidated financial position of Wayside Technology Group, Inc. and Subsidiaries as of December 31, 2014 and 2013, and the consolidated results of their operations and their cash flows for each of the years in the three-year period ended December 31, 2014, in conformity with accounting principles generally accepted in the United States of America.
In connection with our audits of the consolidated financial statements referred to above, we also audited the consolidated financial statement schedule, Schedule II — Valuation and Qualifying Accounts, for each of the years in the three-year period ended December 31, 2014. In our opinion, this financial schedule, when considered in relation to the consolidated financial statements taken as a whole, presents fairly, in all material respects, the information stated therein.
|
/s/ EisnerAmper LLP |
|
|
|
|
|
Iselin, New Jersey |
|
|
|
|
|
February 20, 2015 |
|
F-2
Wayside Technology Group, Inc. and Subsidiaries
Consolidated Balance Sheets
(Amounts in thousands, except share and per share amounts)
|
|
|
December 31, |
|
|
|
|
2014 |
|
2013 |
|
|
Assets |
|
|
|
|
|
|
Current assets: |
|
|
|
|
|
|
Cash and cash equivalents |
|
$ |
23,124 |
|
$ |
19,609 |
|
|
Accounts receivable, net of allowances of $1,819 and $1,429 in 2014 and 2013, respectively |
|
60,782 |
|
60,796 |
|
|
Inventory, net |
|
1,491 |
|
1,315 |
|
|
Prepaid expenses and other current assets |
|
933 |
|
2,117 |
|
|
Deferred income taxes |
|
245 |
|
218 |
|
|
Total current assets |
|
86,575 |
|
84,055 |
|
|
|
|
|
|
|
|
|
Equipment and leasehold improvements, net |
|
412 |
|
324 |
|
|
Accounts receivable-long-term |
|
7,660 |
|
10,006 |
|
|
Other assets |
|
152 |
|
159 |
|
|
Deferred income taxes |
|
182 |
|
216 |
|
|
|
|
$ |
94,981 |
|
$ |
94,760 |
|
|
Liabilities and Stockholders’ Equity |
|
|
|
|
|
|
Current liabilities: |
|
|
|
|
|
|
Accounts payable and accrued expenses |
|
$ |
55,414 |
|
$ |
60,039 |
|
|
Total current liabilities |
|
55,414 |
|
60,039 |
|
|
|
|
|
|
|
|
|
Commitments and Contingencies |
|
|
|
|
|
|
|
|
|
|
|
|
|
Stockholders’ equity: |
|
|
|
|
|
|
Common Stock, $.01 par value; 10,000,000 shares authorized; 5,284,500 shares issued; and 4,890,756 and 4,653,293 shares outstanding in 2014 and 2013, respectively |
|
53 |
|
53 |
|
|
Additional paid-in capital |
|
31,013 |
|
28,791 |
|
|
|
|
|
|
|
|
|
Treasury stock, at cost, 393,744 and 631,207 shares in 2014 and 2013, respectively |
|
(6,166 |
) |
(7,017 |
) |
|
|
|
|
|
|
|
|
Retained earnings |
|
15,225 |
|
12,695 |
|
|
Accumulated other comprehensive (loss) income |
|
(558 |
) |
199 |
|
|
Total stockholders’ equity |
|
39,567 |
|
34,721 |
|
|
|
|
$ |
94,981 |
|
$ |
94,760 |
|
The accompanying notes are an integral part of the consolidated financial statements.
F-3
Wayside Technology Group, Inc. and Subsidiaries
Consolidated Statements of Earnings
(Amounts in thousands, except per share amounts)
|
|
|
Years ended December 31, |
|
|
|
|
2014 |
|
2013 |
|
2012 |
|
|
|
|
|
|
|
|
|
|
|
Net sales |
|
$ |
340,758 |
|
$ |
300,390 |
|
$ |
297,057 |
|
|
|
|
|
|
|
|
|
|
|
Cost of sales |
|
315,948 |
|
276,035 |
|
273,165 |
|
|
Gross profit |
|
24,810 |
|
24,355 |
|
23,892 |
|
|
|
|
|
|
|
|
|
|
|
Selling, general and administrative expenses |
|
16,513 |
|
15,505 |
|
15,377 |
|
|
Income from operations |
|
8,297 |
|
8,850 |
|
8,515 |
|
|
|
|
|
|
|
|
|
|
|
Other income: |
|
|
|
|
|
|
|
|
Interest, net |
|
472 |
|
562 |
|
557 |
|
|
Foreign currency transaction (loss) gain |
|
(11 |
) |
— |
|
17 |
|
|
Income before provision for income taxes |
|
8,758 |
|
9,412 |
|
9,089 |
|
|
|
|
|
|
|
|
|
|
|
Provision for income taxes |
|
2,998 |
|
3,019 |
|
3,600 |
|
|
|
|
|
|
|
|
|
|
|
Net income |
|
$ |
5,760 |
|
$ |
6,393 |
|
$ |
5,489 |
|
|
|
|
|
|
|
|
|
|
|
Income per common share-Basic |
|
$ |
1.24 |
|
$ |
1.44 |
|
$ |
1.23 |
|
|
Income per common share-Diluted |
|
$ |
1.23 |
|
$ |
1.41 |
|
$ |
1.19 |
|
|
|
|
|
|
|
|
|
|
|
Weighted average common shares outstanding-Basic |
|
4,661 |
|
4,454 |
|
4,476 |
|
|
Weighted average common shares outstanding-Diluted |
|
4,702 |
|
4,526 |
|
4,628 |
|
The accompanying notes are an integral part of the consolidated financial statements.
F-4
Wayside Technology Group, Inc. and Subsidiaries
Consolidated Statements of Comprehensive Income
(Amounts in thousands)
|
|
|
Years ended December 31, |
|
|
|
|
2014 |
|
2013 |
|
2012 |
|
|
|
|
|
|
|
|
|
|
|
Net income |
|
$ |
5,760 |
|
$ |
6,393 |
|
$ |
5,489 |
|
|
|
|
|
|
|
|
|
|
|
Other comprehensive (loss) income, net of tax: |
|
|
|
|
|
|
|
|
Foreign currency translation adjustment |
|
(757 |
) |
(229 |
) |
80 |
|
|
Reclassification adjustment for loss realized in net income on available-for-sale marketable securities |
|
— |
|
11 |
|
— |
|
|
Unrealized gain on available—for-sale marketable securities |
|
— |
|
— |
|
8 |
|
|
Other comprehensive (loss) income |
|
(757 |
) |
(218 |
) |
88 |
|
|
|
|
|
|
|
|
|
|
|
Comprehensive income |
|
$ |
5,003 |
|
$ |
6,175 |
|
$ |
5,577 |
|
The accompanying notes are an integral part of the consolidated financial statements.
F-5
Wayside Technology Group, Inc. and Subsidiaries
Consolidated Statements of Stockholders’ Equity
(Amounts in thousands, except share amounts)
|
|
|
Common Stock |
|
Additional
Paid-In |
|
Treasury |
|
Retained |
|
Accumulated
Other
Comprehensive |
|
|
|
|
|
|
Shares |
|
Amount |
|
Capital |
|
Shares |
|
Amount |
|
Earnings |
|
(loss) income |
|
Total |
|
|
|
|
|
|
|
|
|
|
|
|
|
|
|
|
|
|
|
|
|
Balance at January 1, 2012 |
|
5,284,500 |
|
53 |
|
$ |
26,725 |
|
604,622 |
|
$ |
(4,991 |
) |
$ |
6,818 |
|
$ |
329 |
|
$ |
28,934 |
|
|
Net income |
|
|
|
|
|
|
|
|
|
|
|
5,489 |
|
|
|
5,489 |
|
|
Translation adjustment |
|
|
|
|
|
|
|
|
|
|
|
|
|
80 |
|
80 |
|
|
Unrealized loss on available- for sale securities |
|
|
|
|
|
|
|
|
|
|
|
|
|
8 |
|
8 |
|
|
Dividends paid |
|
|
|
|
|
|
|
|
|
|
|
(2,991 |
) |
|
|
(2,991 |
) |
|
Stock options exercised |
|
|
|
|
|
124 |
|
(63,500 |
) |
306 |
|
|
|
|
|
430 |
|
|
Share-based compensation expense |
|
|
|
|
|
1,071 |
|
|
|
|
|
|
|
|
|
1,071 |
|
|
Tax benefit from share-based compensation |
|
|
|
|
|
224 |
|
|
|
|
|
|
|
|
|
224 |
|
|
Restricted stock grants (net of forfeitures) |
|
|
|
|
|
(432 |
) |
(88,475 |
) |
432 |
|
|
|
|
|
— |
|
|
Treasury shares repurchased |
|
|
|
|
|
|
|
90,980 |
|
(1,120 |
) |
|
|
|
|
(1,120 |
) |
|
Balance at December 31, 2012 |
|
5,284,500 |
|
53 |
|
27,712 |
|
543,627 |
|
(5,373 |
) |
9,316 |
|
417 |
|
32,125 |
|
|
Net income |
|
|
|
|
|
|
|
|
|
|
|
6,393 |
|
|
|
6,393 |
|
|
Translation adjustment |
|
|
|
|
|
|
|
|
|
|
|
|
|
(229 |
) |
(229 |
) |
|
Reclassification adjustment for loss realized in net income on available-for-sale marketable securities |
|
|
|
|
|
|
|
|
|
|
|
|
|
11 |
|
11 |
|
|
Dividends paid |
|
|
|
|
|
|
|
|
|
|
|
(3,014 |
) |
|
|
(3,014 |
) |
|
Stock options exercised |
|
|
|
|
|
65 |
|
(25,000 |
) |
136 |
|
|
|
|
|
201 |
|
|
Share-based compensation Expense |
|
|
|
|
|
1,127 |
|
|
|
|
|
|
|
|
|
1,127 |
|
|
Tax benefit from share-based compensation |
|
|
|
|
|
163 |
|
|
|
|
|
|
|
|
|
163 |
|
|
Restricted stock grants (net of forfeitures) |
|
|
|
|
|
(276 |
) |
(55,725 |
) |
276 |
|
|
|
|
|
— |
|
|
Treasury shares repurchased |
|
|
|
|
|
|
|
168,305 |
|
(2,056 |
) |
|
|
|
|
(2,056 |
) |
|
Balance at December 31, 2013 |
|
5,284,500 |
|
53 |
|
28,791 |
|
631,207 |
|
(7,017 |
) |
12,695 |
|
199 |
|
34,721 |
|
|
Net income |
|
|
|
|
|
|
|
|
|
|
|
5,760 |
|
|
|
5,760 |
|
|
Translation adjustment |
|
|
|
|
|
|
|
|
|
|
|
|
|
(757 |
) |
(757 |
) |
|
Dividends paid |
|
|
|
|
|
|
|
|
|
|
|
(3,230 |
) |
|
|
(3,230 |
) |
|
Stock options exercised |
|
|
|
|
|
552 |
|
(220,000 |
) |
1,239 |
|
|
|
|
|
1,791 |
|
|
Share-based compensation expense |
|
|
|
|
|
1,338 |
|
|
|
|
|
|
|
|
|
1,338 |
|
|
Tax benefit from share-based compensation |
|
|
|
|
|
716 |
|
|
|
|
|
|
|
|
|
716 |
|
|
Restricted stock grants (net of forfeitures) |
|
|
|
|
|
(384 |
) |
(64,202 |
) |
384 |
|
|
|
|
|
— |
|
|
Treasury shares repurchased |
|
|
|
|
|
|
|
46,739 |
|
(772 |
) |
|
|
|
|
(772 |
) |
|
Balance at December 31, 2014 |
|
5,284,500 |
|
$ |
53 |
|
$ |
31,013 |
|
393,744 |
|
$ |
(6,166 |
) |
$ |
15,225 |
|
$ |
(558 |
) |
$ |
39,567 |
|
|
|
|
|
|
|
|
|
|
|
|
|
|
|
|
|
|
|
|
|
|
|
|
|
The accompanying notes are an integral part of the consolidated financial statements
F-6
Wayside Technology Group, Inc. and Subsidiaries
Consolidated Statements of Cash Flows
(Amounts in thousands)
|
|
|
Year ended December 31, |
|
|
|
|
2014 |
|
2013 |
|
2012 |
|
|
Cash flows from operating activities |
|
|
|
|
|
|
|
|
Net income |
|
$ |
5,760 |
|
$ |
6,393 |
|
$ |
5,489 |
|
|
Adjustments to reconcile net income to net cash provided by operating activities: |
|
|
|
|
|
|
|
|
Depreciation and amortization expense |
|
226 |
|
274 |
|
302 |
|
|
Provision for doubtful accounts receivable |
|
43 |
|
188 |
|
272 |
|
|
Deferred income tax expense |
|
7 |
|
82 |
|
64 |
|
|
Share-based compensation expense |
|
1,305 |
|
1,127 |
|
1,071 |
|
|
Changes in operating assets and liabilities: |
|
|
|
|
|
|
|
|
Accounts receivable |
|
1,740 |
|
1,975 |
|
(17,463 |
) |
|
Inventory |
|
(176 |
) |
402 |
|
(477 |
) |
|
Prepaid expenses and other current assets |
|
1,171 |
|
(840 |
) |
719 |
|
|
Accounts payable and accrued expenses |
|
(4,333 |
) |
827 |
|
13,419 |
|
|
Net change in other operating assets and liabilities |
|
2 |
|
(90 |
) |
(21 |
) |
|
Net cash provided by operating activities |
|
5,745 |
|
10,338 |
|
3,375 |
|
|
Cash flows (used in) provided by investing activities |
|
|
|
|
|
|
|
|
Purchase of equipment and leasehold improvements |
|
(311 |
) |
(219 |
) |
(215 |
) |
|
Purchase of available-for-sale securities |
|
— |
|
(920 |
) |
(7,295 |
) |
|
Redemptions of available-for-sale securities |
|
— |
|
5,342 |
|
8,268 |
|
|
Net cash (used in) provided by investing activities |
|
(311 |
) |
4,203 |
|
758 |
|
|
Cash flows used in financing activities |
|
|
|
|
|
|
|
|
Purchase of treasury stock |
|
(772 |
) |
(2,056 |
) |
(1,120 |
) |
|
Proceeds from stock option exercises |
|
1,791 |
|
201 |
|
430 |
|
|
Tax benefit from share-based compensation |
|
716 |
|
163 |
|
224 |
|
|
Dividends paid |
|
(3,230 |
) |
(3,014 |
) |
(2,991 |
) |
|
Repayment of capital lease obligations |
|
— |
|
(55 |
) |
(76 |
) |
|
Net cash used in financing activities |
|
(1,495 |
) |
(4,761 |
) |
(3,533 |
) |
|
Effect of foreign exchange rate on cash |
|
(424 |
) |
(6 |
) |
33 |
|
|
Net increase in cash and cash equivalents |
|
3,515 |
|
9,774 |
|
633 |
|
|
Cash and cash equivalents at beginning of year |
|
19,609 |
|
9,835 |
|
9,202 |
|
|
Cash and cash equivalents at end of year |
|
$ |
23,124 |
|
$ |
19,609 |
|
$ |
9,835 |
|
|
|
|
|
|
|
|
|
|
|
Supplementary disclosure of cash flow information: |
|
|
|
|
|
|
|
|
Income taxes paid |
|
$ |
2,431 |
|
$ |
2,980 |
|
$ |
3,339 |
|
The accompanying notes are an integral part of the consolidated financial statements.
F-7
Wayside Technology Group, Inc. and Subsidiaries
Notes to Consolidated Financial Statements
(Amounts in tables in thousands, except share and per share amounts)
Note 1. Description of Business
Wayside Technology Group, Inc. and Subsidiaries (the “Company”), was incorporated in Delaware in 1982. The Company distributes software developed by others through resellers indirectly to customers worldwide. We also resell computer software and hardware developed by others and provide technical services directly to customers in the United States of America (“USA”) and Canada. We also operate a sales branch in Europe to serve our customers in this region of the world. We offer an extensive line of products from leading publishers of software and tools for virtualization/cloud computing, security, networking, storage & infrastructure management, application lifecycle management and other technically sophisticated domains as well as computer hardware.
The Company is organized into two reportable operating segments. The “Lifeboat Distribution” segment distributes technical software to corporate resellers, value added resellers (VARs), consultants and systems integrators worldwide. The “TechXtend” segment is a value-added reseller of software, hardware and services for corporations, government organizations and academic institutions in the USA and Canada.
Note 2. Summary of Significant Accounting Policies
Principles of Consolidation and Operations
The consolidated financial statements include the accounts of Wayside Technology Group, Inc. and its wholly owned subsidiaries. All intercompany transactions and balances have been eliminated.
Use of Estimates
The preparation of consolidated financial statements in conformity with accounting principles generally accepted in the United States of America (“US GAAP”) requires management to make extensive use of certain estimates and assumptions which affect the reported amounts of assets and liabilities and disclosure of contingent assets and liabilities at the date of the financial statements and the reported amounts of revenues and expenses during the reporting periods. The significant areas of estimation include but are not limited to accounting for allowance for doubtful accounts, sales returns, inventory obsolescence, income taxes, depreciation, contingencies and stock-based compensation. Actual results could differ from those estimates.
Net Income Per Common Share
The Company calculates earnings per share in accordance with Financial Accounting Standards Board “FASB”ASC Topic 260, “Earnings Per Share”. Basic earnings per share is calculated by dividing net income attributable to common stockholders by the weighted average number of shares of Common Stock outstanding during the period. Diluted earnings per share is calculated by dividing net income attributable to common stockholders by the weighted average number of common shares outstanding, adjusted for potentially dilutive securities including unexercised stock option grants and nonvested shares of restricted stock.
F-8
Wayside Technology Group, Inc. and Subsidiaries
Notes to Consolidated Financial Statements
(Amounts in tables in thousands, except share and per share amounts)
A reconciliation of the numerators and denominators of the basic and diluted per share computations follows:
|
|
|
Year ended December 31, |
|
|
|
|
2014 |
|
2013 |
|
2012 |
|
|
Numerator: |
|
|
|
|
|
|
|
|
Net income |
|
$ |
5,760 |
|
$ |
6,393 |
|
$ |
5,489 |
|
|
Denominator: |
|
|
|
|
|
|
|
|
Weighted average shares (Basic) |
|
4,661 |
|
4,454 |
|
4,476 |
|
|
Dilutive effect of outstanding options and nonvested shares of restricted stock |
|
41 |
|
72 |
|
152 |
|
|
|
|
|
|
|
|
|
|
|
Weighted average shares including assumed conversions (Diluted) |
|
4,702 |
|
4,526 |
|
4,628 |
|
|
|
|
|
|
|
|
|
|
|
Basic net income per share |
|
$ |
1.24 |
|
$ |
1.44 |
|
$ |
1.23 |
|
|
Diluted net income per share |
|
$ |
1.23 |
|
$ |
1.41 |
|
$ |
1.19 |
|
Cash Equivalents
The Company considers all liquid short-term investments with original maturities of 90 days or less to be cash equivalents.
Accounts Receivable
Accounts receivable principally represents amounts collectible from our customers. The Company performs ongoing credit evaluations of its customers but generally does not require collateral to support any outstanding obligation.
Allowance for Doubtful Accounts Receivable
We provide allowances for doubtful accounts related to accounts receivable for estimated losses resulting from the inability of our customers to make required payments. We take into consideration the overall quality and aging of the receivable portfolio along with specifically identified customer risks. If actual customer payment performance were to deteriorate to an extent not expected, additional allowances may be required. We historically have a low write-off rate, especially on extended payment terms sales transactions. Write-offs on extended payment terms sales transactions as a percentage of net sales amounted to 0%, 0% and 0.033%, respectively, for the years ended December 31, 2014, 2013 and 2012.
Foreign Currency Translation
Assets and liabilities of the Company’s foreign subsidiaries have been translated at current exchange rates, and related revenues and expenses have been translated at average rates of exchange in effect during the year. Cumulative translation adjustments have been classified within accumulated other comprehensive income, which is a separate component of stockholders’ equity in accordance FASB ASC Topic No. 220, “Comprehensive Income”.
F-9
Wayside Technology Group, Inc. and Subsidiaries
Notes to Consolidated Financial Statements
(Amounts in tables in thousands, except share and per share amounts)
Concentration of Credit Risk
Financial instruments that potentially subject the Company to concentrations in credit risk consist of cash and cash equivalents.
The Company’s cash and cash equivalents, at times, may exceed federally insured limits. The Company’s cash and cash equivalents are deposited primarily in banking institutions with global operations. The Company has not experienced any losses in such accounts. The Company believes it is not exposed to any significant credit risk on cash and cash equivalents.
Financial Instruments
The carrying amounts of financial instruments, including cash and cash equivalents, accounts receivable and accounts payable approximated fair value as of December 31, 2014 and 2013, because of the relative short maturity of these instruments. The Company’s accounts receivable long-term is discounted to their present value at prevailing market rates so the balances approximate fair value.
Inventory
Inventory, consisting primarily of finished products held for resale, is stated at the lower of cost (weighted average) or market.
Equipment and Leasehold Improvements
Equipment and leasehold improvements are stated at cost. Equipment depreciation is calculated using the straight-line method over three to five years. Leasehold improvements are amortized using the straight line method over the estimated useful lives of the assets or the related lease terms, whichever is shorter.
Accounts receivable-long-term
Accounts receivable—long-term result from product sales with extended payment terms that are discounted to their present values at the prevailing market rates. In subsequent periods, the accounts receivable are increased to the amounts due and payable by the customers through the accretion of interest income on the unpaid accounts receivable due in future years. The amounts under these long-term accounts receivable due within one year are reclassified to the current portion of accounts receivable.
F-10
Wayside Technology Group, Inc. and Subsidiaries
Notes to Consolidated Financial Statements
(Amounts in tables in thousands, except share and per share amounts)
Comprehensive Income
Comprehensive income consists of net income for the period, the impact of unrealized foreign currency translation adjustments and unrealized gains or losses on available-for-sale marketable securities. The foreign currency translation adjustments are not currently adjusted for income taxes as they relate to permanent investments in international subsidiaries.
Revenue Recognition
Revenue on product (software and hardware) and maintenance agreement sales are recognized once four criteria are met: (1) persuasive evidence of an arrangement exists, (2) the price is fixed and determinable, (3) delivery (software and hardware) or fulfillment (maintenance) has occurred, and (4) there is reasonable assurance of collection of the sales proceeds. Revenues from the sales of hardware products, software products and licenses and maintenance agreements are recognized on a gross basis with the selling price to the customer recorded as sales and the acquisition cost of the product recorded as cost of sales.
Product delivery to customers occur in a variety of ways, including (i) as physical product shipped from the Company’s warehouse, (ii) via drop-shipment by the vendor, or (iii) via electronic delivery for software licenses. The Company leverages drop-ship arrangements with many of its vendors and suppliers to deliver products to customers without having to physically hold the inventory at its warehouse, thereby increasing efficiency and reducing costs. The Company recognizes revenue for drop-ship arrangements on a gross basis. Furthermore, in such drop-ship arrangements, the Company negotiates price with the customer, pays the supplier directly for the product shipped and bears credit risk of collecting payment from its customers. The Company serves as the principal with the customer and, therefore, recognizes the sale and cost of sale of the product upon receiving notification from the supplier that the product has shipped. Maintenance agreements allow customers to obtain technical support directly from the software publisher and to upgrade, at no additional cost, to the latest technology if new applications are introduced by the software publisher during the period that the maintenance agreement is in effect.
Sales are recorded net of discounts, rebates, and returns. Vendor rebates and price protection are recorded when earned as a reduction to cost of sales or merchandise inventory, as applicable.
Cooperative reimbursements from vendors, which are earned and available, are recorded in the period the related advertising expenditure is incurred. Cooperative reimbursements are recorded as a reduction of cost of sales in accordance with FASB ASC Topic 605-50 “Accounting by a Customer (including reseller) for Certain Consideration Received from a Vendor.” Provisions for returns are estimated based on historical sales returns and credit memo analysis which are adjusted to actual on a periodic basis.
Stock-Based Compensation
The Company has stockholder-approved stock incentive plans for employees and directors. Stock- based compensation is recognized based on the grant date fair value and is recognized as expense on a straight-line basis over the requisite service period, which is generally the vesting period.
F-11
Wayside Technology Group, Inc. and Subsidiaries
Notes to Consolidated Financial Statements
(Amounts in tables in thousands, except share and per share amounts)
Income Taxes
The Company utilizes the asset and liability method of accounting for income taxes. Under this method, deferred tax assets and liabilities are determined based on differences between financial reporting and tax basis of assets and liabilities and are measured using enacted tax rates and laws that will be in effect when the differences are expected to reverse. This method also requires a valuation allowance against the net deferred tax asset if, based on the weighted available evidence, it is more likely than not that some or all of the deferred tax assets will not be realized. The Company’s policy is to recognize interest and penalties related to uncertain tax positions in income tax expense when assessed. The Company accounts for uncertainties in accordance with FASB ASC 740 “Income Taxes”. This standard clarified the accounting for uncertainties in income taxes. The standard prescribes criteria for recognition and measurement of tax positions. It also provides guidance on derecognition, classification, interest and penalties, and disclosures related to income taxes associated with uncertain tax positions.
Recently Issued Accounting Pronouncements
In May 2014, the FASB issued guidance for revenue recognition for contracts, superseding the previous revenue recognition requirements, along with most existing industry-specific guidance. The guidance requires an entity to review contracts in five steps: 1) identify the contract, 2) identify performance obligations, 3) determine the transaction price, 4) allocate the transaction price, and 5) recognize revenue. The new standard will result in enhanced disclosures regarding the nature, amount, timing and uncertainty of revenue arising from contracts with customers. The standard is effective for our reporting year beginning January 1, 2017 and early adoption is not permitted. We are currently evaluating the impact of this new accounting pronouncement, if any; the pronouncement will have on our consolidated financial statements.
3. Balance Sheet Detail
Equipment and leasehold improvements, net consist of the following as of December 31:
|
|
|
2014 |
|
2013 |
|
|
|
|
|
|
|
|
|
Equipment |
|
$ |
2,744 |
|
$ |
2,771 |
|
|
Leasehold improvements |
|
565 |
|
555 |
|
|
|
|
3,309 |
|
3,326 |
|
|
Less accumulated depreciation and amortization |
|
(2,897 |
) |
(3,002 |
) |
|
|
|
$ |
412 |
|
$ |
324 |
|
Accounts payable and accrued expenses consist of the following as of December 31:
|
|
|
2014 |
|
2013 |
|
|
|
|
|
|
|
|
|
Trade accounts payable |
|
$ |
52,328 |
|
$ |
56,973 |
|
|
Accrued expenses |
|
3,086 |
|
3,066 |
|
|
|
|
$ |
55,414 |
|
$ |
60,039 |
|
F-12
Wayside Technology Group, Inc. and Subsidiaries
Notes to Consolidated Financial Statements
(Amounts in tables in thousands, except share and per share amounts)
Accumulated other comprehensive income (loss) consists of the following as of December 31:
|
|
|
2014 |
|
2013 |
|
|
|
|
|
|
|
|
|
Foreign currency translation adjustments |
|
$ |
(558 |
) |
$ |
199 |
|
|
|
|
$ |
(558 |
) |
$ |
199 |
|
4. Income Taxes
Deferred tax attributes resulting from differences between financial and accounting amounts and tax basis of assets and liabilities at December 31, 2014 and 2013 are as follows:
|
|
|
2014 |
|
2013 |
|
|
Current assets |
|
|
|
|
|
|
Accruals and reserves |
|
$ |
245 |
|
$ |
218 |
|
|
Net current deferred tax assets |
|
$ |
245 |
|
$ |
218 |
|
|
|
|
2013 |
|
2012 |
|
|
Non-current assets |
|
|
|
|
|
|
Accruals and reserves |
|
$ |
206 |
|
$ |
204 |
|
|
Depreciation and amortization |
|
(24 |
) |
12 |
|
|
Net non-current deferred tax assets |
|
$ |
182 |
|
$ |
216 |
|
|
Total deferred tax assets |
|
$ |
427 |
|
$ |
434 |
|
The provision for income taxes is as follows:
|
|
|
Year ended December 31, |
|
|
|
|
2014 |
|
2013 |
|
2012 |
|
|
Current: |
|
|
|
|
|
|
|
|
Federal |
|
$ |
2,693 |
|
$ |
2,873 |
|
$ |
2,799 |
|
|
State |
|
79 |
|
15 |
|
536 |
|
|
Foreign |
|
219 |
|
49 |
|
201 |
|
|
|
|
2,991 |
|
2,937 |
|
3,536 |
|
|
Deferred: |
|
|
|
|
|
|
|
|
Federal |
|
6 |
|
13 |
|
54 |
|
|
State |
|
1 |
|
69 |
|
10 |
|
|
|
|
7 |
|
82 |
|
64 |
|
|
|
|
$ |
2,998 |
|
$ |
3,019 |
|
$ |
3,600 |
|
|
Effective Tax Rate |
|
34.2 |
% |
32.1 |
% |
39.6 |
% |
The current year effective tax rates are higher than the prior year primarily due to fact the prior year included an adjustment to reflect a change in state apportionment rules.
F-13
Wayside Technology Group, Inc. and Subsidiaries
Notes to Consolidated Financial Statements
(Amounts in tables in thousands, except share and per share amounts)
The reasons for the difference between total tax expense and the amount computed by applying the U.S. statutory federal income tax rate to income before income taxes are as follows:
|
|
|
Year ended December 31, |
|
|
|
|
2014 |
|
2013 |
|
2012 |
|
|
|
|
|
|
|
|
|
|
|
Statutory rate applied to pretax income |
|
$ |
2,978 |
|
$ |
3,200 |
|
$ |
3,090 |
|
|
State income taxes, net of federal income tax benefit |
|
52 |
|
91 |
|
334 |
|
|
Foreign income taxes under U.S. statutory rate |
|
(56 |
) |
(20 |
) |
(21 |
) |
|
Other items, including the impact of the change in NJ state tax rate |
|
24 |
|
(252 |
) |
197 |
|
|
Income tax expense |
|
$ |
2,998 |
|
$ |
3,019 |
|
$ |
3,600 |
|
The Company receives a tax deduction from the income realized by employees on the exercise of certain non-qualified stock options and restricted stock awards for which the tax effect of the difference between the book and tax deduction is recognized as a component of stockholders’ equity.
The Company has analyzed filing positions in all of the federal and state jurisdictions where it is required to file income tax returns, as well as all open tax years in these jurisdictions. The Company has identified its federal consolidated tax return and its state tax return in New Jersey and its Canadian tax return as major tax jurisdictions. As of December 31, 2014, the Company’s 2013 Federal tax return remains open for examination, as the Company recently concluded an Internal Revenue Service examination for the 2011 and 2012 tax years. This examination resulted in no change to the previously filed Federal corporate tax returns. The Company’s New Jersey and Canadian tax returns are open for examination for the years 2011 through 2013. The Company’s policy is to recognize interest related to unrecognized tax benefits as interest expense and penalties as operating expenses. The Company believes that it has appropriate support for the income tax positions it takes and expects to take on its tax returns, and that its accruals for tax liabilities are adequate for all open years based on an assessment of many factors including past experience and interpretations of tax law applied to the facts of each matter.
For financial reporting purposes, income before income taxes includes the following components:
|
|
|
Year ended December 31 |
|
|
|
|
2014 |
|
2013 |
|
2012 |
|
|
United States |
|
$ |
8,011 |
|
$ |
8,746 |
|
$ |
8,451 |
|
|
Canada |
|
747 |
|
666 |
|
638 |
|
|
|
|
$ |
8,758 |
|
$ |
9,412 |
|
$ |
9,089 |
|
F-14
Wayside Technology Group, Inc. and Subsidiaries
Notes to Consolidated Financial Statements
(Amounts in tables in thousands, except share and per share amounts)
5. Credit Facility
On January 4, 2013, the Company entered into a $10,000,000 revolving credit facility (the “Credit Facility”) with Citibank, N.A. (“Citibank”) pursuant to a Business Loan Agreement (the “Loan Agreement”), Promissory Note (the “Note”), Commercial Security Agreements (the “Security Agreements”) and Commercial Pledge Agreement (the “Pledge Agreement”). The Credit Facility will be used for business and working capital purposes, including financing of larger extended payment terms sales transactions. The Credit Facility matures on January 4, 2016, at which time the Company must pay this loan in one payment of any outstanding principal plus all accrued unpaid interest. In addition, the Company will pay regular monthly payments of all accrued unpaid interest. The interest rate for any borrowings under the Credit Facility is subject to change from time to time based on the changes in an independent index which is the LIBOR Rate (the “Index”). If the Index becomes unavailable during the term of this loan, Citibank may designate a substitute index after notifying the Company. Interest on the unpaid principal balance of the Note will be calculated using a rate of 1.500 percentage points over the Index. The Credit Facility is secured by the assets of the Company.
Among other affirmative covenants set forth in the Loan Agreement, the Company must maintain (i) a ratio of Total Liabilities to Tangible Net Worth (each as defined in the Loan Agreement) of not greater than 2.50 to 1.00, to be tested quarterly and (ii) a minimum Debt Service Coverage Ratio (as defined in the Loan Agreement) of 2.00 to 1.00. Additionally, the Loan Agreement contains negative covenants related to, among other items, prohibitions against the creation of certain liens, engaging in any business activities substantially different than those currently engaged in by the Company, and paying dividends on the Company’s stock other than (i) dividends payable in its stock and (ii) cash dividends in amounts and frequency consistent with past practice, without first securing the written consent of Citibank. The Company is in compliance with all covenants at December 31, 2014.
At December 31, 2014, the Company had no borrowings outstanding under the Credit Facility. The Company had interest expense of $10 thousand related to the Credit Facility for the year ended December 31, 2013.
6. Stockholders’ Equity and Stock Based Compensation
On April 21, 1995, the Board of Directors adopted the Company’s 1995 Employee Stock Plan (“1995 Plan”). The 1995 Plan, as amended on May 7, 1998, provides for the grant of options to purchase up to 1,137,500 shares of the Company’s Common Stock to officers, directors, employees and consultants of the Company. The 1995 Plan requires that each option shall expire on the date specified by the Compensation Committee, but not more than ten years from its date of grant in the case of Incentive Stock Options (“ISO’s”) and Non-Qualified Options. Options granted under the plan are exercisable at an exercise price equal to but not less than the fair market value of the Common Stock on the grant date. ISO’s shall either be fully exercisable on the date of grant or shall become exercisable thereafter in such installments as the committee may specify.
On April 21, 1995, the Board of Directors adopted the Company’s 1995 Non-Employee Director Plan (“1995 Director Plan”). The 1995 Director Plan, as amended on May 7, 1998, provides for the grant of options to purchase up to 187,500 shares of the Company’s Common Stock to persons who are members of the Company’s Board of Directors and not employees or officers of the Company. The 1995 Director Plan requires that options granted thereunder will expire ten years from the date of grant. Each option granted under the 1995 Director Plan becomes exercisable over a five year period, and vests in an installment of 20% of the total option grant upon the expiration of one year from the date of the option grant, and thereafter vests in equal quarterly installments of 5%.
F-15
Wayside Technology Group, Inc. and Subsidiaries
Notes to Consolidated Financial Statements
(Amounts in tables in thousands, except share and per share amounts)
In February 2002, the Board of Directors approved a plan permitting all option holders under the 1995 Plan and 1995 Director Plan to surrender all or any portion of their options on or before March 1, 2002. By March 1, 2002, a total of 303,550 options to purchase the Company’s Common Stock under the 1995 Plan and 1995 Director Plan were surrendered. All of the options surrendered were exercisable in excess of the market price of the underlying Common Stock as of the dates of surrender.
At the annual stockholder’s meeting held on June 14, 2006, the Company’s stockholders approved the 2006 Stock-Based Compensation Plan (the “2006 Plan”). The 2006 Plan authorizes the grant of Stock Options, Stock Units, Stock Appreciation Rights, Restricted Stock, Deferred Stock, Stock Bonuses, and other equity-based awards. The number of shares of Common Stock initially available under the 2006 Plan is 800,000. As of December 31, 2014, there are no shares of common stock available for future award grants to employees and directors under this plan.
At the annual stockholder’s meeting held on June 6, 2012, the Company’s stockholders approved the 2012 Stock-Based Compensation Plan (the “2012 Plan”). The 2012 Plan authorizes the grant of Stock Options, Stock Units, Stock Appreciation Rights, Restricted Stock, Deferred Stock, Stock Bonuses and other equity-based awards. The total number of shares of Common Stock initially available for award under the 2012 Plan was 600,000. As of December 31, 2014, the number of shares of Common stock available for future award grants to employees and directors under the 2012 Plan is 513,848.
In August of 2006, the Company granted a total of 315,000 shares of Restricted Stock to officers, directors and employees. Included in this grant were 200,000 Restricted Shares granted to the Company’s CEO in accordance with his employment agreement. These 200,000 Restricted Shares vest over 40 equal quarterly installments. The remaining grants of Restricted Stock vest over 20 equal quarterly installments.
During 2007, the Company granted a total of 30,000 shares of Restricted Stock to officers, directors and employees. These shares of Restricted Stock vest over 20 equal quarterly installments. A total of 12,500 shares of restricted common stock were forfeited as a result of employees and officers terminating employment with the Company.
During 2008, the Company granted a total of 57,500 shares of Restricted Stock to officers, directors and employees. These shares of Restricted Stock vest over 20 equal quarterly installments. A total of 3,500 shares of Restricted Stock were forfeited as a result of employees and officers terminating employment with the Company.
During 2009, the Company granted a total of 140,000 shares of Restricted Stock to officers and employees. These shares of Restricted Stock vest over 20 equal quarterly installments.
During 2010, the Company granted a total of 150,500 shares of Restricted Stock to officers and employees. These shares of Restricted Stock vest over 20 equal quarterly installments. A total of 5,875 shares of Restricted Stock were forfeited as a result of employees and officers terminating employment with the Company.
F-16
Wayside Technology Group, Inc. and Subsidiaries
Notes to Consolidated Financial Statements
(Amounts in tables in thousands, except share and per share amounts)
During 2011, the Company granted a total of 15,000 shares of Restricted Stock to employees. These shares of Restricted Stock vest over 20 equal quarterly installments. A total of 8,375 shares of Restricted Stock were forfeited as a result of employees terminating employment with the Company.
During 2012, the Company granted a total of 92,000 shares of Restricted Stock to officers, directors, and employees. These shares of Restricted Stock vest over 20 equal quarterly installments. A total of 3,525 shares of Restricted Stock were forfeited as a result of employees terminating employment with the Company.
During 2013, the Company granted a total of 56,500 shares of Restricted Stock to officers and employees. Included in these grants were 40,000 Restricted Shares granted to the Company’s CEO in accordance with the satisfaction of certain performance criteria included in his compensation plan. These 40,000 Restricted Shares vest over 16 equal quarterly installments. The remaining grants of Restricted Stock vest over 20 equal quarterly installments. A total of 775 shares of Restricted Stock were forfeited as a result of employees terminating employment with the Company.
During 2014, the Company granted a total of 98,689 shares of Restricted Stock to officers, directors and employees. These shares of Restricted Stock vest between one and twenty equal quarterly installments. A total of 34,487 shares of Restricted Stock were forfeited as a result of officers and employees terminating employment with the Company.
Changes during 2012, 2013 and 2014 in options outstanding under the Company’s combined plans (i.e. the 2012 Plan, the 2006 Plan, the 1995 Non-Employee Director Plan and the 1995 Stock Plan) were as follows:
|
|
|
Number
of
Options |
|
Weighted
Average
Exercise
Price |
|
|
Outstanding at January 1, 2012 |
|
374,140 |
|
8.33 |
|
|
Granted in 2012 |
|
— |
|
— |
|
|
Canceled in 2012 |
|
— |
|
— |
|
|
Exercised in 2012 |
|
63,500 |
|
6.78 |
|
|
Outstanding at December 31, 2012 |
|
310,640 |
|
8.65 |
|
|
Granted in 2013 |
|
— |
|
— |
|
|
Canceled in 2013 |
|
— |
|
— |
|
|
Exercised in 2013 |
|
25,000 |
|
8.03 |
|
|
Outstanding at December 31, 2013 |
|
285,640 |
|
8.71 |
|
|
Granted in 2014 |
|
— |
|
— |
|
|
Canceled in 2014 |
|
15,000 |
|
3.04 |
|
|
Exercised in 2014 |
|
220,000 |
|
8.14 |
|
|
Outstanding at December 31, 2014 |
|
50,640 |
|
12.85 |
|
|
Exercisable at December 31, 2014 |
|
50,640 |
|
$ |
12.85 |
|
|
|
|
|
|
|
|
F-17
Wayside Technology Group, Inc. and Subsidiaries
Notes to Consolidated Financial Statements
(Amounts in tables in thousands, except share and per share amounts)
The options exercisable at December 31, 2014 and 2013 were 50,640 and 285,640 respectively.
The aggregate intrinsic value of options outstanding and options exercisable as of December 31, 2014 was $0.2 million. The intrinsic value is calculated as the difference between the market value as of December 31, 2014 and the exercise price of the shares. The market value as of December 31, 2014 was $17.21 per share as reported by The NASDAQ Global Market.
Stock options outstanding at December 31, 2014 are summarized as follows:
|
Range of Exercise
Prices |
|
Outstanding
Options as of
December 31,
2014 |
|
Weighted
Average
Remaining
Contractual
Life |
|
Weighted
Average
Exercise
Price |
|
Options
Exercisable
as of
December 31,
2014 |
|
Weighted
Average
Exercise
Price |
|
|
|
|
|
|
|
|
|
|
|
|
|
|
|
10.00–12.99 |
|
50,640 |
|
0.3 |
|
12.85 |
|
50,640 |
|
12.85 |
|
|
|
|
50,640 |
|
0.3 |
|
$ |
12.85 |
|
50,640 |
|
$ |
12.85 |
|
|
|
|
|
|
|
|
|
|
|
|
|
|
|
Under the various plans, options that are cancelled can be reissued. At December 31, 2014 no options were reserved for future issuance.
A summary of nonvested shares of Restricted Stock awards outstanding under the Company’s 2006 Plan and 2012 Plan as of December 31, 2014, 2013 and 2012 and changes during the three years ended December 31, 2014, 2013 and 2012 is as follows:
|
|
|
Shares |
|
Weighted
Average Grant
Date
Fair Value |
|
|
Nonvested shares at January 1, 2011 |
|
262,275 |
|
$ |
10.44 |
|
|
Granted in 2012 |
|
92,000 |
|
12.32 |
|
|
Vested in 2012 |
|
(99,600 |
) |
10.10 |
|
|
Forfeited in 2012 |
|
(3,525 |
) |
11.79 |
|
|
Nonvested shares at December 31, 2012 |
|
251,150 |
|
$ |
11.24 |
|
|
Granted in 2013 |
|
56,500 |
|
12.57 |
|
|
Vested in 2013 |
|
(107,325 |
) |
10.33 |
|
|
Forfeited in 2013 |
|
(775 |
) |
9.77 |
|
|
Nonvested shares at December 31, 2013 |
|
199,550 |
|
$ |
12.02 |
|
|
Granted in 2014 |
|
98,689 |
|
16.03 |
|
|
Vested in 2014 |
|
(101,143 |
) |
11.94 |
|
|
Forfeited in 2014 |
|
(34,487 |
) |
11.62 |
|
|
Nonvested shares at December 31, 2014 |
|
162,609 |
|
$ |
14.36 |
|
As of December 31, 2014, there was approximately $2.3 million of total unrecognized compensation cost related to nonvested share-based compensation arrangements. The unrecognized compensation cost is expected to be recognized over a weighted-average period of 2.8 years.
For the years ended December 31, 2014, 2013 and 2012, we recognized share-based compensation cost of approximately $1.3 million, $1.1 million and $1.1 million, respectively, which is included in selling, general and administrative expenses. The Company does not capitalize any share-based compensation cost.
F-18
Wayside Technology Group, Inc. and Subsidiaries
Notes to Consolidated Financial Statements
(Amounts in tables in thousands, except share and per share amounts)
7. Defined Contribution Plan
The Company maintains a defined contribution plan covering substantially all domestic employees. Participating employees may make contributions to the plan, through payroll deductions. Matching contributions are made by the Company equal to 50% of the employee’s contribution to the extent such employee contribution did not exceed 6% of their compensation. During the years ended December 31, 2014, 2013 and 2012, the Company expensed approximately $194 thousand, $182 thousand and $166 thousand, respectively, related to this plan.
8. Commitments and Contingencies
Leases
Operating leases primarily relate to the lease of the space used for our operations in Shrewsbury and Eatontown, New Jersey, Mississauga, Canada and Almere, Netherlands. Future minimum rental commitments under non-cancellable operating leases are as follows:
|
2015 |
|
$ |
325 |
|
|
2016 |
|
115 |
|
|
2017 |
|
54 |
|
|
2018 |
|
— |
|
|
2019 |
|
— |
|
|
|
|
$ |
494 |
|
Rent expense for the years ended December 31, 2014, 2013 and 2012 was approximately $262 thousand, $253 thousand and $229 thousand, respectively.
Employment Agreements
In the event that Simon Nynens, President and Chief Executive officer, employment is terminated without cause or by the rendering of a non-renewal notification, he is entitled to receive a severance payment equal to twelve months cash compensation, immediate vesting of all outstanding equity awards, and to purchase the car used by him at the “buy-out” price of any lease or fair market value, as applicable. Additionally, in the event that a change of control of the Company occurs (as described in the employment agreement), Mr. Nynens’ outstanding equity awards become immediately vested and he is entitled to receive a lump-sum payment equal to 2.9 times his then annual salary and actual incentive bonus earned in the year prior to such change in control.
The Company has entered into severance agreements with its Vice President and Chief Information Officer and Vice President and Chief Accounting Officer, under which they are entitled to a severance payment and severance payments, respectively for six months at the then applicable annual base salary if the Company terminates their respective employment for any reason other than for cause.
Other
As of December 31, 2014, the Company has no standby letters of credit, has no standby repurchase obligations or other commercial commitments. The Company has a line of credit see Note 5 (Credit Facility). Other than employment arrangements and other management compensation arrangements, the Company is not engaged in any transactions with related parties.
F-19
Wayside Technology Group, Inc. and Subsidiaries
Notes to Consolidated Financial Statements
(Amounts in tables in thousands, except share and per share amounts)
9. Industry, Segment and Geographic Information
The Company distributes software developed by others through resellers indirectly to customers worldwide. We also resell computer software and hardware developed by others and provide technical services directly to customers in the USA and Canada. We also operate a sales branch in Europe to serve our customers in this region of the world.
Geographic revenue and identifiable assets related to operations as of and for the years ended December 31, 2014, 2013 and 2012 were as follows. Revenue is allocated to a geographic area based on the location of the sale, which is generally the customer’s country of domicile. No one country other than the USA represents more than 10% of net sales for 2014, 2013 or 2012.
|
|
|
2014 |
|
2013 |
|
2012 |
|
|
Net sales to Unaffiliated Customers: |
|
|
|
|
|
|
|
|
USA |
|
$ |
294,274 |
|
$ |
254,337 |
|
$ |
251,991 |
|
|
Canada |
|
23,757 |
|
21,602 |
|
22,245 |
|
|
Rest of the world |
|
22,727 |
|
24,451 |
|
22,821 |
|
|
Total |
|
$ |
340,758 |
|
$ |
300,390 |
|
$ |
297,057 |
|
|
|
|
2014 |
|
2013 |
|
2012 |
|
|
Identifiable Assets by Geographic Areas at December 31, |
|
|
|
|
|
|
|
|
USA |
|
$ |
87,324 |
|
$ |
87,025 |
|
$ |
85,503 |
|
|
Canada |
|
7,657 |
|
7,735 |
|
5,942 |
|
|
Total |
|
$ |
94,981 |
|
$ |
94,760 |
|
$ |
91,445 |
|
FASB ASC Topic 280, “Segment Reporting,” requires that public companies report profits and losses and certain other information on their “reportable operating segments” in their annual and interim financial statements. The internal organization used by the Company’s Chief Operating Decision Maker (CODM) to assess performance and allocate resources determines the basis for reportable operating segments. The Company’s CODM is the Chief Executive Officer.
The Company is organized into two reportable operating segments. The “Lifeboat Distribution” segment distributes technical software to corporate resellers, value added resellers (VARs), consultants and systems integrators worldwide. The “TechXtend” segment is a value-added reseller of software, hardware and services for corporations, government organizations and academic institutions in the USA and Canada.
As permitted by FASB ASC Topic 280, the Company has utilized the aggregation criteria in combining its operations in Canada with the domestic segments as they provide the same products and services to similar clients and are considered together when the CODM decides how to allocate resources.
Segment income is based on segment revenue less the respective segment’s cost of revenues as well as segment direct costs (including such items as payroll costs and payroll related costs, such as profit sharing, incentive awards and insurance) and excluding general and administrative expenses not attributed to a business unit. The Company only identifies accounts receivable and inventory by segment as shown below as “Selected Assets” by segment; it does not allocate its other assets, including capital expenditures by segment.
F-20
Wayside Technology Group, Inc. and Subsidiaries
Notes to Consolidated Financial Statements
(Amounts in tables in thousands, except share and per share amounts)
|
|
|
Year ended |
|
|
|
|
December 31, |
|
|
|
|
2014 |
|
2013 |
|
2012 |
|
|
Revenue: |
|
|
|
|
|
|
|
|
Lifeboat Distribution |
|
$ |
290,449 |
|
$ |
237,632 |
|
$ |
217,342 |
|
|
TechXtend |
|
50,309 |
|
62,758 |
|
79,715 |
|
|
|
|
340,758 |
|
300,390 |
|
297,057 |
|
|
Gross Profit: |
|
|
|
|
|
|
|
|
Lifeboat Distribution |
|
$ |
19,194 |
|
$ |
17,448 |
|
$ |
15,818 |
|
|
TechXtend |
|
5,616 |
|
6,907 |
|
8,074 |
|
|
|
|
24,810 |
|
24,355 |
|
23,892 |
|
|
Direct Costs: |
|
|
|
|
|
|
|
|
Lifeboat Distribution |
|
$ |
5,660 |
|
$ |
4,717 |
|
$ |
4,512 |
|
|
TechXtend |
|
3,104 |
|
3,280 |
|
3,567 |
|
|
|
|
8,764 |
|
7,997 |
|
8,079 |
|
|
Segment Income Before Taxes: |
|
|
|
|
|
|
|
|
Lifeboat Distribution |
|
$ |
13,534 |
|
$ |
12,731 |
|
$ |
11,306 |
|
|
TechXtend |
|
2,512 |
|
3,627 |
|
4,507 |
|
|
Segment Income Before Taxes |
|
16,046 |
|
16,358 |
|
15,813 |
|
|
|
|
|
|
|
|
|
|
|
General and administrative |
|
7,749 |
|
7,508 |
|
7,298 |
|
|
Interest income |
|
472 |
|
562 |
|
557 |
|
|
Foreign currency translation |
|
(11 |
) |
— |
|
17 |
|
|
Income before taxes |
|
$ |
8,758 |
|
$ |
9,412 |
|
$ |
9,089 |
|
|
|
|
As of
December
31, 2014 |
|
As of
December
31,2013 |
|
|
Selected Assets By Segment: |
|
|
|
|
|
|
Lifeboat Distribution |
|
$ |
39,780 |
|
$ |
30,630 |
|
|
TechXtend |
|
30,153 |
|
41,487 |
|
|
Segment Select Assets |
|
69,933 |
|
72,117 |
|
|
Corporate Assets |
|
25,048 |
|
22,643 |
|
|
Total Assets |
|
$ |
94,981 |
|
$ |
94,760 |
|
The Company had three customers that each accounted for more than 10% of total sales for 2014. For the year ended December 31, 2014, Software House International Corporation (“SHI”), CDW Corporation (“CDW”) and Insight Enterprises, Inc. (“Insight”) accounted for 17.4%, 16.4% and 11.0%, respectively, of consolidated net sales and, as of December 31, 2014, 15.3%, 17.9%, and 7.9%, respectively, of total net accounts receivable. For the year ended December 31, 2014, Sophos was the only individual vendor from whom our purchases exceeded 10% of our total purchases and accounted for 14.7% of our total purchases. For the year ended December 31, 2013, SHI, CDW, and Insight accounted for 14.9%, 13.8% and 12.2%, respectively, of consolidated net sales. For the year ended December 31, 2013, Dell/Quest Software was the only individual vendor from whom our purchases exceeded 10% of our total purchases and accounted for 10.2% of our total purchases. For the year ended December 31, 2012, SHI, CDW, and Insight accounted for 13.4%, 12.4% and 11.1%, respectively, of consolidated net sales. For the year ended December 31, 2012 Dell/Quest Software was the only individual vendor from whom our purchases exceeded 10% of our total purchases and accounted for 13.4% of our total purchases. Our top five customers accounted for 52%, 48%, and 44% of consolidated net sales in 2014, 2013 and 2012, respectively.
F-21
Wayside Technology Group, Inc. and Subsidiaries
Notes to Consolidated Financial Statements
(Amounts in tables in thousands, except share and per share amounts)
10. Quarterly Results of Operations (Unaudited)
The following table presents summarized quarterly results for 2014:
|
|
|
First |
|
Second |
|
Third |
|
Fourth |
|
|
|
|
|
|
|
|
|
|
|
|
|
Net sales |
|
$ |
71,730 |
|
$ |
84,399 |
|
$ |
90,506 |
|
$ |
94,123 |
|
|
Gross profit |
|
5,538 |
|
6,138 |
|
6,176 |
|
6,957 |
|
|
Net income |
|
1,059 |
|
1,483 |
|
1,369 |
|
1,849 |
|
|
|
|
|
|
|
|
|
|
|
|
|
Basic net income per common share |
|
$ |
0.23 |
|
$ |
0.33 |
|
$ |
0.29 |
|
$ |
0.39 |
|
|
Diluted net income per common share |
|
$ |
0.23 |
|
$ |
0.32 |
|
$ |
0.29 |
|
$ |
0.39 |
|
The following table presents summarized quarterly results for 2013:
|
|
|
First |
|
Second |
|
Third |
|
Fourth |
|
|
|
|
|
|
|
|
|
|
|
|
|
Net sales |
|
$ |
65,980 |
|
$ |
74,095 |
|
$ |
70,462 |
|
$ |
89,853 |
|
|
Gross profit |
|
5,313 |
|
5,965 |
|
5,265 |
|
7,812 |
|
|
Net income |
|
1,020 |
|
1,540 |
|
1,330 |
|
2,503 |
|
|
|
|
|
|
|
|
|
|
|
|
|
Basic net income per common share |
|
$ |
0.23 |
|
$ |
0.35 |
|
$ |
0.30 |
|
$ |
0.56 |
|
|
Diluted net income per common share |
|
$ |
0.22 |
|
$ |
0.34 |
|
$ |
0.29 |
|
$ |
0.55 |
|
F-22
Wayside Technology Group, Inc. and Subsidiaries
Schedule II—Valuation and Qualifying Accounts
(Amounts in thousands)
|
Description |
|
Beginning
Balance |
|
Charged to
Cost and
Expense |
|
Deductions |
|
Ending
Balance |
|
|
|
|
|
|
|
|
|
|
|
|
|
Year ended December 31, 2012 |
|
|
|
|
|
|
|
|
|
|
Allowances for accounts receivable |
|
$ |
1,513 |
|
$ |
272 |
|
$ |
199 |
|
$ |
1,586 |
|
|
Reserve for inventory obsolescence |
|
$ |
35 |
|
$ |
24 |
|
$ |
32 |
|
$ |
27 |
|
|
Year ended December 31, 2013 |
|
|
|
|
|
|
|
|
|
|
Allowances for accounts receivable |
|
$ |
1,586 |
|
$ |
188 |
|
$ |
345 |
|
$ |
1,429 |
|
|
Reserve for inventory obsolescence |
|
$ |
27 |
|
$ |
5 |
|
$ |
16 |
|
$ |
16 |
|
|
Year ended December 31, 2014 |
|
|
|
|
|
|
|
|
|
|
Allowances for accounts receivable |
|
$ |
1,429 |
|
$ |
43 |
|
$ |
(347 |
) |
$ |
1,819 |
|
|
Reserve for inventory obsolescence |
|
$ |
16 |
|
$ |
6 |
|
$ |
12 |
|
$ |
10 |
|
F-23