|
x
|
ANNUAL
REPORT PURSUANT TO SECTION 13 OR 15(d) OF THE SECURITIES EXCHANGE ACT OF
1934.
|
|
o
|
TRANSITION
REPORT PURSUANT TO SECTION 13 OR 15(d) OF THE SECURITIES EXCHANGE ACT OF
1934.
|
|
Delaware
|
13-3136104
|
|
|
(State
or other jurisdiction of incorporation)
|
(IRS
Employer Identification Number)
|
|
|
1157
Shrewsbury Avenue, Shrewsbury, New Jersey
|
07702
|
|
|
(Address
of principal executive offices)
|
(Zip
Code)
|
|
Title of Each
Class
|
Name of Each Exchange
on Which Registered
|
|
|
Common Stock, par value $0.01
per share
|
The Nasdaq Global
Market
|
|
|
Name
|
Age
|
Position
|
||
|
Simon
F. Nynens
|
37
|
Chairman,
President and Chief Executive Officer
|
||
|
Richard
J. Bevis
|
59
|
Vice
President Marketing
|
||
|
Daniel
T. Jamieson
|
51
|
Vice
President and General Manager-Lifeboat
|
||
|
Vito
Legrottaglie
|
44
|
Vice
President-Operations
|
||
|
Kevin
T. Scull
|
43
|
Vice
President and Chief Accounting Officer
|
||
|
Shawn
J. Giordano
|
39
|
Vice
President-Programmers and
TechXtend
|
|
High
|
Low
|
|||||||
|
2008
|
||||||||
|
First
Quarter
|
$ | 11.370 | $ | 7.490 | ||||
|
Second
Quarter
|
10.820 | 7.090 | ||||||
|
Third
Quarter
|
9.000 | 6.450 | ||||||
|
Fourth
Quarter
|
7.740 | 4.930 | ||||||
|
2007
|
||||||||
|
First
Quarter
|
$ | 16.080 | $ | 14.500 | ||||
|
Second
Quarter
|
16.580 | 13.700 | ||||||
|
Third
Quarter
|
18.650 | 13.220 | ||||||
|
Fourth
Quarter
|
14.060 | 8.710 | ||||||
|
Total
Number of Shares Purchased
|
Average
Price Paid Per Share
|
Total
Number of Shares Purchased as Part of Publicly Announced Plans or
Programs
|
Average
Price Paid Per Share
|
Maximum
Number of Shares That May Yet Be Purchased Under the Plans or
Programs
|
||||||||||||||||
|
Period
|
(2)
|
(3)
|
(4)
|
|||||||||||||||||
|
October
1- October 31, 2008
|
4,226 | $ | 7.16 | 4,226 | $ | 7.16 | 601,400 | |||||||||||||
|
November
1- November 30, 2008
|
17,160 | (1) | $ | 7.22 | 13,023 | $ | 7.05 | 588,377 | ||||||||||||
|
December
1 - December 31, 2008
|
14,121 | $ | 6.94 | 14,121 | $ | 6.94 | 574,256 | |||||||||||||
|
Total
|
35,507 | $ | 7.10 | 31,370 | $ | 7.02 | 574,256 | |||||||||||||
|
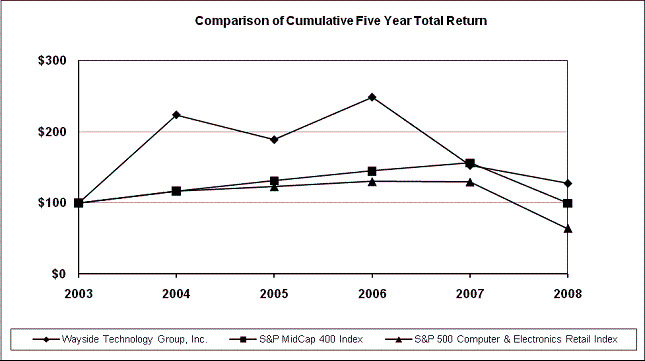
INDEXED
RETURNS
|
||||||||||||||||||||||||
|
Base
|
Years
Ending
|
|||||||||||||||||||||||
|
Period
|
||||||||||||||||||||||||
|
Company
/ Index
|
Dec03
|
Dec04
|
Dec05
|
Dec06
|
Dec07
|
Dec08
|
||||||||||||||||||
|
Wayside
Technology Group, Inc.
|
100 | 223.87 | 189.01 | 248.74 | 152.83 | 127.73 | ||||||||||||||||||
|
S&P
MidCap 400 Index
|
100 | 116.48 | 131.11 | 144.64 | 156.18 | 99.59 | ||||||||||||||||||
|
S&P
500 Computer & Electronics Retail Index
|
100 | 116.74 | 122.97 | 130.28 | 129.77 | 63.90 | ||||||||||||||||||
|
Year Ended December
31,
|
||||||||||||||||||||
|
(In
thousands, except per share data)
|
||||||||||||||||||||
|
2004
|
2005
|
2006
|
2007
|
2008
|
||||||||||||||||
|
Consolidated
Statement of Operations Data:
|
||||||||||||||||||||
|
Net
sales
|
$ | 103,582 | $ | 137,655 | $ | 182,319 | $ | 179,865 | $ | 174,025 | ||||||||||
|
Cost
of sales
|
91,243 | 122,685 | 165,350 | 162,630 | 157,228 | |||||||||||||||
|
Gross
profit
|
12,339 | 14,970 | 16,969 | 17,235 | 16,797 | |||||||||||||||
|
Selling,
general and
|
||||||||||||||||||||
|
administrative
expenses
|
10,173 | 12,203 | 12,163 | 12,081 | 12,207 | |||||||||||||||
|
Income
from operations
|
2,166 | 2,767 | 4,806 | 5,154 | 4,590 | |||||||||||||||
|
Other
income, net
|
112 | 300 | 741 | 991 | 744 | |||||||||||||||
|
Income
before income taxes
|
2,278 | 3,067 | 5,547 | 6,145 | 5,334 | |||||||||||||||
|
Income
tax provision (benefit)
|
(4,044 | ) | 414 | 2,279 | 2,442 | 2,168 | ||||||||||||||
|
Net
income
|
$ | 6,322 | $ | 2,653 | $ | 3,268 | $ | 3,703 | $ | 3,166 | ||||||||||
|
Net
income per share:
|
||||||||||||||||||||
|
Basic
|
$ | 1.65 | $ | 0.67 | $ | 0.78 | $ | 0.84 | $ | 0.72 | ||||||||||
|
Diluted
|
$ | 1.51 | $ | 0.61 | $ | 0.72 | $ | 0.80 | $ | 0.71 | ||||||||||
|
Weighted
average common
|
||||||||||||||||||||
|
shares
outstanding:
|
||||||||||||||||||||
|
Basic
|
3,828 | 3,976 | 4,191 | 4,406 | 4,414 | |||||||||||||||
|
Diluted
|
4,180 | 4,384 | 4,521 | 4,656 | 4,461 | |||||||||||||||
|
December
31,
|
||||||||||||||||||||
|
2004
|
2005
|
2006
|
2007
|
2008
|
||||||||||||||||
|
Balance
Sheet Data:
|
||||||||||||||||||||
|
Cash
and cash equivalents
|
$ | 4,888 | $ | 7,369 | $ | 13,832 | $ | 14,241 | $ | 9,349 | ||||||||||
|
Marketable
securities
|
6,595 | 7,884 | 7,032 | 9,641 | 9,367 | |||||||||||||||
|
Working
capital
|
12,756 | 14,595 | 16,471 | 19,479 | 14,806 | |||||||||||||||
|
Total
assets
|
32,914 | 44,268 | 57,281 | 56,753 | 47,485 | |||||||||||||||
|
Total
stockholders' equity
|
16,495 | 17,998 | 21,298 | 24,492 | 23,884 | |||||||||||||||
|
Years
ended December 31,
|
||||||||||||
|
2006
|
2007
|
2008
|
||||||||||
|
Net
sales
|
100.0 | % | 100.0 | % | 100.0 | % | ||||||
|
Cost
of sales
|
90.7 | 90.4 | 90.3 | |||||||||
|
Gross
profit
|
9.3 | 9.6 | 9.7 | |||||||||
|
Selling,
general and administrative expenses
|
6.7 | 6.7 | 7.0 | |||||||||
|
Income
from operations
|
2.6 | 2.9 | 2.7 | |||||||||
|
Other
income, net
|
0.4 | 0.5 | 0.4 | |||||||||
|
Income
before income taxes
|
3.0 | 3.4 | 3.1 | |||||||||
|
Income
tax provision
|
1.2 | 1.4 | 1.3 | |||||||||
|
Net
income
|
1.8 | % | 2.0 | % | 1.8 | % | ||||||
|
Contractual
Obligations
|
||||||||||||||||||||
|
(Dollars
in thousands)
|
||||||||||||||||||||
|
Payment
due by Period
|
||||||||||||||||||||
|
Total
|
Less
than 1 year
|
1-3
years
|
4-5
years
|
After
5 years
|
||||||||||||||||
|
Long-term
debt
|
- | - | - | - | - | |||||||||||||||
|
Capital
Lease Obligations
|
- | - | - | - | - | |||||||||||||||
|
Operating
Leases(1)
|
$ | 1,434 | $ | 429 | $ | 1,005 | - | - | ||||||||||||
|
Unconditional
Purchase Obligations
|
- | - | - | - | - | |||||||||||||||
|
Other
Long term Obligations
|
||||||||||||||||||||
|
reflected
on the Company's
|
||||||||||||||||||||
|
Balance
Sheet under GAAP
|
- | - | - | - | - | |||||||||||||||
|
Total Contractual
Obligations
|
$ | 1,434 | $ | 429 | $ | 1,005 | - | - | ||||||||||||
|
(a)
|
The
following documents are filed as part of this
Report:
|
|
|
1.
|
Consolidated
Financial Statements (See Index to Consolidated Financial
Statements on page F-1 of this
report);
|
|
2.
|
Financial
Statement
Schedule:
|
|
3.
|
Exhibits
Required by Regulation S‑K, Item
601:
|
|
Exhibit
No.
|
Description of
Exhibit
|
|
3.1
|
Form
of Amended and Restated Certificate of Incorporation of the Company.
(1)
|
|
3.1(a)
|
Certificate
of Amendment of Restated Certificate of Incorporation of the
Company.(2)
|
|
3.2
|
Form
of Amended and Restated By-Laws of the Company.(1)
|
|
4.1
|
Specimen
of Common Stock Certificate.(1)
|
|
10.17
|
1986
Stock Option Plan and Form of Employee Stock Option Agreement.
(1)
|
|
10.18
|
1995
Stock Plan, as amended. (3)
|
|
10.19
|
1995
Non-Employee Director Plan, as amended. (3)
|
|
10.19(a)
|
2006
Stock-Based Compensation Plan. (4)
|
|
10.19(b)
|
First
Amendment to 2006 Stock-Based Compensation Plan. (5)
|
|
10.19(c)
|
Second
Amendment to 2006 Stock-Based Compensation Plan. (5)
|
|
10.20
|
Form
of Officer and Director Indemnification Agreement. (1)
|
|
10.42
|
Lease
dated as of May 14, 1997 between Robert C. Baker, et al as Landlord and
the Company (6)
|
|
10.42(a)
|
Modification
of Lease, dated as of July 27, 2006, between SBC Holdings, L.P. (successor
in interest to Robert C. Baker, et al.) and the Company.
(2)
|
|
10.43
|
Employment
Agreement, dated January 12, 2006, between the Company and Simon F. Nynens.
(7)
|
|
10.45
|
Offer
Letter, dated January 6, 2003, from the Company to Vito
Legrottaglie.(8)
|
|
10.46
|
Resignation
Letter, dated May 16, 2007, from Wayside Technology Group, Inc. to Jeffrey
Largiader. (9)
|
|
10.47
|
General
Release, dated May 18, 2007, between Jeffrey Largiader and Wayside
Technology Group, Inc. (5)
|
|
10.48
|
Restricted
Stock Letter, dated August 15, 2006, between Vito Legrottaglie and Wayside
Technology Group, Inc (f/k/a Programmer’s Paradise Inc.)
(5)
|
|
10.49
|
Restricted
Stock Letter, dated August 15, 2006, between Jeffrey Largiader and Wayside
Technology Group, Inc (f/k/a Programmer’s Paradise Inc.)
(5)
|
|
10.50
|
Restricted
Stock Letter, dated August 15, 2006, between Daniel Jamieson and Wayside
Technology Group, Inc (f/k/a Programmer’s Paradise Inc.)
(5)
|
|
10.51
|
Restricted
Stock Letter, dated August 15, 2006, between Allan Weingarten and Wayside
Technology Group, Inc (f/k/a Programmer’s Paradise Inc.)
(5)
|
|
10.52
|
Restricted
Stock Letter, dated August 15, 2006, between Edwin Morgens and Wayside
Technology Group, Inc (f/k/a Programmer’s Paradise Inc.)
(5)
|
|
10.53
|
Restricted
Stock Letter, dated August 15, 2006, between Duff Meyercord and Wayside
Technology Group, Inc (f/k/a Programmer’s Paradise Inc.)
(5)
|
|
10.54
|
Restricted
Stock Letter, dated August 15, 2006, between Simon F. Nynens and
Wayside Technology Group, Inc (f/k/a Programmer’s Paradise
Inc.) (5)
|
|
10.55
|
Restricted
Stock Letter, dated August 15, 2006, between Simon F. Nynens and Wayside
Technology Group, Inc (f/k/a Programmer’s Paradise Inc.)
(5)
|
|
10.56
|
Restricted
Stock Letter, dated August 15, 2006, between Kevin Scull and Wayside
Technology Group, Inc (f/k/a Programmer’s Paradise Inc.)
(5)
|
|
10.57
|
Restricted
Stock Letter, dated January 31, 2007, between William Willett and Wayside
Technology Group, Inc (f/k/a Programmer’s Paradise Inc.)
(5)
|
|
10.58
|
Restricted
Stock Letter, dated November 19, 2007, between Richard Bevis and Wayside
Technology Group, Inc (f/k/a Programmer’s Paradise Inc.)
(5)
|
|
10.59
|
Form
of Non-Qualified Stock Option Agreement (5)
|
|
10.60
|
Restricted
Stock Letter, dated February 5, 2008, between Kevin Scull and Wayside
Technology Group, Inc. (10)
|
|
10.61
|
Restricted
Stock Letter, dated February 5, 2008, between Richard Bevis and Wayside
Technology Group, Inc. (10)
|
|
10.62
|
Restricted
Stock Letter, dated February 5, 2008, between Simon Nynens and Wayside
Technology Group, Inc. (10)
|
|
10.63
|
Restricted
Stock Letter, dated February 5, 2008, between Vito Legrottaglie and
Wayside Technology Group, Inc. (10)
|
|
10.64
|
Restricted
Stock Letter, dated February 5, 2008, between Daniel Jamieson and Wayside
Technology Group, Inc. (10)
|
|
10.65
|
Restricted
Stock Letter, dated February 5, 2008, between Edwin Morgens and Wayside
Technology Group, Inc. (10)
|
|
10.66
|
Restricted
Stock Letter, dated February 5, 2008, between William Willett and Wayside
Technology Group, Inc. (10)
|
|
10.67
|
Restricted
Stock Letter, dated February 5, 2008, between Allan Weingarten and Wayside
Technology Group, Inc. (10)
|
|
10.68
|
Restricted
Stock Letter, dated February 5, 2008, between Mark Boyer and Wayside
Technology Group, Inc.
(10)
|
|
10.69
|
Restricted
Stock Letter, dated February 5, 2008, between Duff Meyercord and Wayside
Technology Group, Inc. (10)
|
|
21.1
|
Subsidiaries
of the Registrant
|
|
23.1
|
Consent
of Amper, Politziner & Mattia, LLP
|
|
31.1
|
Certification
pursuant to Rule 13a-14(a) or Rule 15d-14(a) of the Securities Exchange
Act of 1934, of Simon F. Nynens, the Chief Executive Officer of the
Company.
|
|
31.2
|
Certification
pursuant to Rule 13a-14(a) or Rule 15d-14(a) of the Securities Exchange
Act of 1934, of Kevin T. Scull, the Chief Accounting Officer of the
Company.
|
|
32.1
|
Certification
pursuant to Rule 13a-14(b) of the Securities Exchange Act of 1934 and 18
U.S.C. Section 1350, as adopted pursuant to Section 906 of the
Sarbanes-Oxley Act of 2002, of Simon F. Nynens, the Chief Executive
Officer of the Company.
|
|
32.2
|
Certification
pursuant to Rule 13a-14(b) of the Securities Exchange Act of 1934 and 18
U.S.C. Section 1350, as adopted pursuant to Section 906 of the
Sarbanes-Oxley Act of 2002, of Kevin T. Scull, the Chief Accounting
Officer of the
Company.
|
|
(1)
|
Incorporated
by reference to exhibits of the same number filed with the Registrant's
Registration Statement on Form S-1 or amendments thereto (File No.
033-92810).
|
|
(2)
|
Incorporated
by reference to the Exhibits of the same number to the Registrant’s
Quarterly Report on Form 10-Q for the quarter ended September 30,
2006 filed on November 3, 2006.
|
|
(3)
|
Incorporated
by reference to Exhibit A and Exhibit B, respectively, to the Registrant’s
Definitive Annual Meeting Proxy Statement filed on April 30,
1998.
|
|
(4)
|
Incorporated
by reference to Exhibit A of the Registrant’s Definitive Annual Meeting
Proxy Statement filed on April 28,
2006.
|
|
(5)
|
Incorporated
by reference to exhibits of the same number filed with the Registrant’s
Annual Report on Form 10‑K for the Year Ended December 31, 2007 filed on
March 13, 2008.
|
|
(6)
|
Incorporated
by reference to Exhibit 10.42 of the Registrant’s Annual Report on Form
10‑K for the year ended December 31, 1998 filed on March 31,
1999.
|
|
(7)
|
Incorporated
by reference to Exhibit 10.43 to the Registrant’s Quarterly Report on Form
10-Q for the quarter ended March 31, 2006 filed on May 12,
2006.
|
|
(8)
|
Incorporated
by reference to exhibits of the same number filed with the Registrant's
Quarterly Report on Form 10-Q for the quarter ended March 31, 2007 filed
on May 15, 2007.
|
|
(9)
|
Incorporated
by reference to exhibits of the same number filed with the Registrant's
Current Report on Form 8‑K filed on May 21,
2007.
|
|
(10)
|
Incorporated
by reference to exhibits of the same number filed with the Registrant’s
Quarterly Report on Form 10-Q for the Period Ended March 31, 2008 filed
May 12, 2008.
|
|
(b)
|
The
exhibits required by Item 601 of Regulation S‑K are reflected above in
Section (a) 3. of this Item.
|
|
|
(c)
|
The
financial statement schedule is included as reflected in Section (a) 2. of
this Item.
|
|
WAYSIDE
TECHNOLOGY GROUP, INC.
|
|||
|
|
By:
|
/s/ Simon F. Nynens | |
| Simon F. Nynens, President and | |||
| Chief Executive Officer | |||
|
Signature
|
Title
|
Date
|
||
|
President
and Chief Executive Officer and
|
March
12, 2009
|
|||
| /s/ Simon F. Nynens |
Chairman
of the Board of Directors
|
|||
|
Simon
F. Nynens
|
(Principal
Executive Officer)
|
|||
|
Vice
President and Chief Accounting Officer
|
March
12, 2009
|
|||
| /s/ Kevin T. Scull |
(Principal
Financial and Accounting Officer)
|
|||
|
Kevin
T. Scull
|
||||
| /s/ William H. Willett |
Director
|
March
12, 2009
|
||
|
William
H. Willett
|
||||
| /s/ Mark T. Boyer |
Director
|
March
12, 2009
|
||
|
Mark
T. Boyer
|
||||
| /s/ F. Duffield Meyercord |
Director
|
March
12, 2009
|
||
|
F.
Duffield Meyercord
|
||||
| /s/ Edwin H. Morgens |
Director
|
March
12, 2009
|
||
|
Edwin
H. Morgens
|
||||
| /s/ Allan D. Weingarten |
Director
|
March
12, 2009
|
||
|
Allan
D. Weingarten
|
|
Page
|
|
|
Report
of Independent Registered Public Accounting Firm
|
F-2
|
|
Consolidated
Balance Sheets
|
F-3
|
|
Consolidated
Statements of Earnings
|
F-4
|
|
Consolidated
Statements of Stockholders’ Equity and Comprehensive
Income
|
F-5
|
|
Consolidated
Statements of Cash Flows
|
F-6
|
|
Notes
to Consolidated Financial Statements
|
F-7
|
|
Schedule
II – Valuation and Qualifying Accounts
|
F-24
|
|
December
31,
|
||||||||
|
2007
|
2008
|
|||||||
|
Assets
|
||||||||
|
Current
assets:
|
||||||||
|
Cash
and cash equivalents
|
$ | 14,241 | $ | 9,349 | ||||
|
Marketable
securities
|
9,641 | 9,367 | ||||||
|
Accounts
receivable, net of allowances of $908 and
$1,086
in 2007 and 2008, respectively
|
24,824 | 16,940 | ||||||
|
Inventory,
net
|
1,116 | 1,058 | ||||||
|
Prepaid
expenses and other current assets
|
927 | 776 | ||||||
|
Deferred
income taxes
|
830 | 712 | ||||||
|
Total
current assets
|
51,579 | 38,202 | ||||||
|
Equipment
and leasehold improvements, net
|
619 | 549 | ||||||
|
Accounts
receivable-long-term
|
3,402 | 7,860 | ||||||
|
Other
assets
|
67 | 66 | ||||||
|
Deferred
income taxes
|
1,086 | 808 | ||||||
| $ | 56,753 | $ | 47,485 | |||||
|
Liabilities
and Stockholders’ Equity
|
||||||||
|
Current
liabilities:
|
||||||||
|
Accounts
payable and accrued expenses
|
$ | 32,100 | $ | 23,396 | ||||
|
Total
current liabilities
|
32,100 | 23,396 | ||||||
|
Other
liabilities
|
161 | 205 | ||||||
|
Total
liabilities
|
32,261 | 23,601 | ||||||
|
Commitments
and Contingencies
|
||||||||
|
Stockholders’
equity:
|
||||||||
|
Common
Stock, $.01 par value; 10,000,000 shares authorized; 5,284,500 shares
issued; and 4,708,498 and 4,643,662 shares outstanding in 2007 and 2008,
respectively
|
53 | 53 | ||||||
|
Additional
paid-in capital
|
28,860 | 26,636 | ||||||
|
Treasury
stock, at cost, 576,002 and 640,838 shares in 2007 and 2008,
respectively
|
(2,283 | ) | (3,383 | ) | ||||
|
Retained
earnings (deficit)
|
(2,599 | ) | 567 | |||||
|
Accumulated
other comprehensive income
|
461 | 11 | ||||||
|
Total
stockholders’ equity
|
24,492 | 23,884 | ||||||
| $ | 56,753 | $ | 47,485 | |||||
|
Years
ended December 31,
|
||||||||||||
|
2006
|
2007
|
2008
|
||||||||||
|
Net
sales
|
$ | 182,319 | $ | 179,865 | $ | 174,025 | ||||||
|
Cost
of sales
|
165,350 | 162,630 | 157,228 | |||||||||
|
Gross
profit
|
16,969 | 17,235 | 16,797 | |||||||||
|
Selling,
general and administrative expenses
|
12,163 | 12,081 | 12,207 | |||||||||
|
Income from
operations
|
4,806 | 5,154 | 4,590 | |||||||||
|
Other
income:
|
||||||||||||
|
Interest
income
|
738 | 989 | 741 | |||||||||
|
Foreign
currency transaction gain
|
3 | 2 | 3 | |||||||||
|
Income
before provision for income taxes
|
5,547 | 6,145 | 5,334 | |||||||||
|
Provision
for income taxes
|
2,279 | 2,442 | 2,168 | |||||||||
|
Net
income
|
$ | 3,268 | $ | 3,703 | $ | 3,166 | ||||||
|
Income
per common share-Basic
|
$ | 0.78 | $ | 0.84 | $ | 0.72 | ||||||
|
Income
per common share-Diluted
|
$ | 0.72 | $ | 0.80 | $ | 0.71 | ||||||
|
Weighted
average common shares outstanding-Basic
|
4,191 | 4,406 | 4,414 | |||||||||
|
Weighted
average common shares outstanding-Diluted
|
4,521 | 4,656 | 4,461 | |||||||||
|
Accumulated
|
||||||||||||||||||||||||||||||||
|
Additional
|
Retained
|
Other
|
||||||||||||||||||||||||||||||
|
Common
Stock
|
Paid-In
|
Treasury
|
earnings
|
Comprehensive
|
||||||||||||||||||||||||||||
|
Shares
|
Amount
|
Capital
|
Shares
|
Amount
|
(Deficit)
|
Income
|
Total
|
|||||||||||||||||||||||||
|
Balance
at January 1, 2006
|
5,284,500 | $ | 53 | $ | 30,948 | 1,289,665 | $ | (3,620 | ) | $ | (9,570 | ) | $ | 187 | $ | 17,998 | ||||||||||||||||
|
Net
income
|
3,268 | 3,268 | ||||||||||||||||||||||||||||||
|
Other
comprehensive income:
|
||||||||||||||||||||||||||||||||
|
Translation
adjustment
|
3 | 3 | ||||||||||||||||||||||||||||||
|
Unrealized
gain on available-
|
||||||||||||||||||||||||||||||||
|
for-sale
securities
|
10 | 10 | ||||||||||||||||||||||||||||||
|
Comprehensive
income
|
3,281 | |||||||||||||||||||||||||||||||
|
Dividends
paid
|
(1,712 | ) | (1,712 | ) | ||||||||||||||||||||||||||||
|
Dividends
declared payable
|
(638 | ) | (638 | ) | ||||||||||||||||||||||||||||
|
Exercise
of stock options
|
368 | (290,555 | ) | 848 | 1,216 | |||||||||||||||||||||||||||
|
Tax
benefit from exercises of
|
||||||||||||||||||||||||||||||||
|
non-qualified
stock options
|
901 | 901 | ||||||||||||||||||||||||||||||
|
Share-based
compensation
|
||||||||||||||||||||||||||||||||
|
expense
|
305 | 305 | ||||||||||||||||||||||||||||||
|
Restricted
stock grants
|
(920 | ) | (315,000 | ) | 920 | - | ||||||||||||||||||||||||||
|
Treasury
shares repurchased
|
3,769 | (53 | ) | (53 | ) | |||||||||||||||||||||||||||
|
Balance
at December 31, 2006
|
5,284,500 | 53 | 29,252 | 687,879 | (1,905 | ) | (6,302 | ) | 200 | 21,298 | ||||||||||||||||||||||
|
Net
income
|
3,703 | 3,703 | ||||||||||||||||||||||||||||||
|
Other
comprehensive income:
|
||||||||||||||||||||||||||||||||
|
Translation
adjustment
|
253 | 253 | ||||||||||||||||||||||||||||||
|
Unrealized
gain on available-
|
||||||||||||||||||||||||||||||||
|
for-sale
securities
|
8 | 8 | ||||||||||||||||||||||||||||||
|
Comprehensive
income
|
3,964 | |||||||||||||||||||||||||||||||
|
Dividends
paid
|
(2,047 | ) | (2,047 | ) | ||||||||||||||||||||||||||||
|
Exercise
of stock options
|
588 | (159,445 | ) | 486 | 1,074 | |||||||||||||||||||||||||||
|
Tax
benefit from exercises of
|
||||||||||||||||||||||||||||||||
|
non-qualified
stock options
|
522 | 522 | ||||||||||||||||||||||||||||||
|
Share-based
compensation
|
||||||||||||||||||||||||||||||||
|
expense
|
605 | 605 | ||||||||||||||||||||||||||||||
|
Restricted
stock grants
|
(60 | ) | (17,500 | ) | 60 | - | ||||||||||||||||||||||||||
|
Treasury
shares repurchased
|
65,068 | (924 | ) | (924 | ) | |||||||||||||||||||||||||||
|
Balance
at December 31, 2007
|
5,284,500 | 53 | 28,860 | 576,002 | (2,283 | ) | (2,599 | ) | 461 | 24,492 | ||||||||||||||||||||||
|
Net
income
|
3,166 | 3,166 | ||||||||||||||||||||||||||||||
|
Other
comprehensive income:
|
||||||||||||||||||||||||||||||||
|
Translation
adjustment
|
(469 | ) | (469 | ) | ||||||||||||||||||||||||||||
|
Unrealized
gain on available-
|
||||||||||||||||||||||||||||||||
|
for-sale
securities
|
19 | 19 | ||||||||||||||||||||||||||||||
|
Comprehensive
income
|
2,716 | |||||||||||||||||||||||||||||||
|
Dividends
paid
|
(2,811 | ) | (2,811 | ) | ||||||||||||||||||||||||||||
|
Exercise
of stock options
|
59 | (45,000 | ) | 164 | 223 | |||||||||||||||||||||||||||
|
Share-based
compensation
|
||||||||||||||||||||||||||||||||
|
expense
|
735 | 735 | ||||||||||||||||||||||||||||||
|
Tax
expense from share-based
|
||||||||||||||||||||||||||||||||
|
compensation
|
(22 | ) | (22 | ) | ||||||||||||||||||||||||||||
|
Restricted
stock grants
|
(185 | ) | (54,000 | ) | 185 | - | ||||||||||||||||||||||||||
|
Treasury
shares repurchased
|
163,836 | (1,449 | ) | (1,449 | ) | |||||||||||||||||||||||||||
|
Balance
at December 31, 2008
|
5,284,500 | $ | 53 | $ | 26,636 | 640,838 | $ | (3,383 | ) | $ | 567 | $ | 11 | $ | 23,884 | |||||||||||||||||
|
Year
ended December 31,
|
||||||||||||
|
2006
|
2007
|
2008
|
||||||||||
|
Cash
flows from operating activities
|
||||||||||||
|
Net
income
|
$ | 3,268 | $ | 3,703 | $ | 3,166 | ||||||
|
Adjustments
to reconcile net income to net cash provided by (used) in operating
activities:
|
||||||||||||
|
Depreciation
expense
|
259 | 351 | 347 | |||||||||
|
Amortization
expense
|
11 | 10 | 8 | |||||||||
|
Provision
for doubtful accounts receivable
|
190 | 47 | 39 | |||||||||
|
Deferred
income tax expense
|
1,214 | 1,170 | 395 | |||||||||
|
Share-based
compensation expense
|
305 | 605 | 735 | |||||||||
|
Loss
on disposal of fixed assets
|
6 | - | 7 | |||||||||
|
Changes
in operating assets and liabilities:
|
||||||||||||
|
Accounts
receivable
|
(9,502 | ) | 2,627 | 2,844 | ||||||||
|
Inventory
|
691 | 149 | 54 | |||||||||
|
Prepaid
expenses and other current assets
|
81 | (320 | ) | 142 | ||||||||
|
Accounts
payable and accrued expenses
|
9,554 | (3,205 | ) | (8,263 | ) | |||||||
|
Net
change in other operating assets and liabilities
|
8 | 114 | 38 | |||||||||
|
Net
cash provided by (used) in operating activities
|
6,085 | 5,251 | (488 | ) | ||||||||
|
Cash
flows provided by (used) in investing activities
|
||||||||||||
|
Purchase
of equipment and leasehold improvements
|
(329 | ) | (482 | ) | (308 | ) | ||||||
|
Purchase
of available-for-sale securities
|
(17,089 | ) | (21,189 | ) | (16,788 | ) | ||||||
|
Redemptions
of available-for-sale securities
|
17,950 | 18,588 | 17,080 | |||||||||
|
Proceeds
from sale of fixed assets
|
10 | - | 8 | |||||||||
|
Net
cash provided by (used) in investing activities
|
542 | (3,083 | ) | (8 | ) | |||||||
|
Cash
flows used in financing activities
|
||||||||||||
|
Purchase
of treasury stock
|
(53 | ) | (924 | ) | (1,449 | ) | ||||||
|
Proceeds
from stock option exercises
|
1,216 | 1,074 | 223 | |||||||||
|
Tax
benefit (expense) from stock options exercises
|
901 | 522 | (22 | ) | ||||||||
|
Dividends
paid
|
(2,231 | ) | (2,684 | ) | (2,811 | ) | ||||||
|
Net
cash used in financing activities
|
(167 | ) | (2,012 | ) | (4,059 | ) | ||||||
|
Effect
of foreign exchange rate on cash
|
3 | 253 | (337 | ) | ||||||||
|
Net
increase (decrease) in cash and cash
equivalents
|
6,463 | 409 | (4,892 | ) | ||||||||
|
Cash
and cash equivalents at beginning of year
|
7,369 | 13,832 | 14,241 | |||||||||
|
Cash
and cash equivalents at end of year
|
$ | 13,832 | $ | 14,241 | $ | 9,349 | ||||||
|
Supplementary
disclosure of cash flow information:
|
||||||||||||
|
Income
taxes paid
|
$ | 294 | $ | 563 | $ | 1,366 | ||||||
|
Year
ended December 31
|
||||||||||||
|
2006
|
2007
|
2008
|
||||||||||
|
Numerator:
|
||||||||||||
|
Net
income
|
$ | 3,268 | $ | 3,703 | $ | 3,166 | ||||||
|
Denominator:
|
||||||||||||
|
Weighted
average shares (Basic)
|
4,191 | 4,406 | 4,414 | |||||||||
|
Dilutive
effect of outstanding options and nonvested shares of restricted
stock
|
330 | 250 | 47 | |||||||||
|
Weighted
average shares including assumed conversions (Diluted)
|
4,521 | 4,656 | 4,461 | |||||||||
|
Basic
net income per share
|
$ | 0.78 | $ | 0.84 | $ | 0.72 | ||||||
|
Diluted
net income per share
|
$ | 0.72 | $ | 0.80 | $ | 0.71 | ||||||
|
Cost
|
Market
value
|
Unrealized gain
(loss)
|
||||||||||
|
U.S.
Government Securities
|
$ | 8,057 | $ | 8,087 | $ | 30 | ||||||
|
Certificates of
deposit
|
1,284 | 1,280 | $ | (4 | ) | |||||||
|
Total
Marketable securities
|
$ | 9,341 | $ | 9,367 | $ | 26 | ||||||
|
Estimated
|
||||||||
|
Cost
|
Fair
Value
|
|||||||
|
Due in
one year or less
|
$ | 9,341 | $ | 9,367 | ||||
|
Cost
|
Market
value
|
Unrealized
gain
|
||||||||||
|
U.S.
Government Securities
|
$ | 9,633 | $ | 9,641 | $ | 8 | ||||||
|
Total
Marketable securities
|
$ | 9,633 | $ | 9,641 | $ | 8 | ||||||
|
Estimated
|
||||||||
|
Cost
|
Fair
Value
|
|||||||
|
Due in
one year or less
|
$ | 9,633 | $ | 9,641 | ||||
|
Fair Value Measurements at December 31, 2008 Using
|
||||||||||||||||
|
(In
thousands)
Description
|
Balance
at
December 31,
2008
|
Quoted Prices
in
Active
Markets
for
Identical
Items
(Level
1)
|
Significant
Other
Observable
Inputs
(Level
2)
|
Significant
Unobservable
Inputs
(Level
3)
|
||||||||||||
|
U.S.
Government Securities
|
$ | 8,087 | $ | 8,087 | $ | - | $ | |||||||||
|
Certificates
of deposit
|
$ | 1,280 | $ | 1,280 | ||||||||||||
|
2007
|
2008
|
|||||||
|
Equipment
|
$ | 2,391 | $ | 2,330 | ||||
|
Leasehold
improvements
|
542 | 549 | ||||||
| 2,933 | 2,879 | |||||||
|
Less
accumulated depreciation and amortization
|
(2,314 | ) | (2,330 | ) | ||||
| $ | 619 | $ | 549 | |||||
|
2007
|
2008
|
|||||||
|
Trade
accounts payable
|
$ | 30,597 | $ | 21,212 | ||||
|
Other
accrued expenses
|
1,503 | 2,184 | ||||||
| $ | 32,100 | $ | 23,396 | |||||
|
December
31,
|
||||||||
|
2007
|
2008
|
|||||||
|
Current
assets
|
||||||||
|
Accruals
and reserves
|
$ | 465 | $ | 441 | ||||
|
Goodwill
|
271 | 271 | ||||||
|
Net
operating loss carry forwards
|
5 | - | ||||||
|
Business
credits
|
89 | - | ||||||
|
Net
current deferred tax assets
|
$ | 830 | $ | 712 | ||||
|
Non-current
assets
|
||||||||
|
Accruals
and reserves
|
$ | 236 | $ | 236 | ||||
|
Depreciation
|
147 | 158 | ||||||
|
Goodwill
|
703 | 414 | ||||||
|
Net non-current deferred tax
assets
|
$ | 1,086 | $ | 808 | ||||
|
Total deferred tax
assets
|
$ | 1,916 | $ | 1,520 | ||||
|
Year
ended December 31,
|
||||||||||||
|
2006
|
2007
|
2008
|
||||||||||
|
Current:
|
||||||||||||
|
Federal
|
$ | 851 | $ | 1,036 | $ | 1,356 | ||||||
|
State
|
135 | - | 213 | |||||||||
|
Canada
|
79 | 236 | 204 | |||||||||
| 1,065 | 1,272 | 1,773 | ||||||||||
|
Deferred:
|
||||||||||||
|
Federal
|
833 | 830 | 280 | |||||||||
|
State
|
381 | 340 | 115 | |||||||||
| 1,214 | 1,170 | 395 | ||||||||||
| $ | 2,279 | $ | 2,442 | $ | 2,168 | |||||||
|
Effective
Tax Rate
|
41.1 | % | 39.7 | % | 40.6 | % | ||||||
|
Year
ended December 31,
|
||||||||||||
|
2006
|
2007
|
2008
|
||||||||||
|
Statutory
rate applied to pretax income
|
$ | 1,885 | $ | 2,089 | $ | 1,813 | ||||||
|
State
income taxes, net of benefit
of
federal income taxes
|
321 | 333 | 239 | |||||||||
|
Foreign
income taxes over U.S.
statutory
rate
|
12 | 35 | 31 | |||||||||
|
Other
items
|
61 | (15 | ) | 85 | ||||||||
|
Income
tax expense
|
$ | 2,279 | $ | 2,442 | $ | 2,168 | ||||||
|
Federal,
State and Foreign Tax
|
||||
|
Balance
at January 1, 2008
|
$ | 230 | ||
|
Additions
based on tax positions related to current year
|
- | |||
|
Gross
Unrecognized Tax Benefit at December 31, 2008
|
$ | 230 | ||
|
Net Unrecognized
Tax Benefit at December 31, 2008
|
$ | 78 | ||
|
Year
ended December 31
|
||||||||||||
|
2006
|
2007
|
2008
|
||||||||||
|
United
States
|
$ | 5,350 | $ | 5,556 | $ | 4,825 | ||||||
|
Canada
|
197 | 589 | 509 | |||||||||
| $ | 5,547 | $ | 6,145 | $ | 5,334 | |||||||
|
Number
of
Options
|
Weighted
Average Exercise Price
|
|||||||
|
Outstanding
at January 1, 2006
|
892,890 | $ | 6.46 | |||||
|
Granted
in 2006
|
- | - | ||||||
|
Canceled
in 2006
|
- | - | ||||||
|
Exercised
in 2006
|
(290,555 | ) | 4.19 | |||||
|
Outstanding
at December 31, 2006
|
602,335 | 7.56 | ||||||
|
Granted
in 2007
|
- | - | ||||||
|
Canceled
in 2007
|
- | - | ||||||
|
Exercised
in 2007
|
(159,445 | ) | 6.75 | |||||
|
Outstanding
at December 31, 2007
|
442,890 | 7.85 | ||||||
|
Granted
in 2008
|
- | - | ||||||
|
Canceled
in 2008
|
(5,000 | ) | 12.85 | |||||
|
Exercised
in 2008
|
(45,000 | ) | 4.96 | |||||
|
Outstanding
at December 31, 2008
|
392,890 | 8.12 | ||||||
|
Exercisable
at December 31, 2008
|
392,890 | $ | 8.12 | |||||
|
Range
of Exercise
Prices
|
Outstanding
Options as of
December
31, 2008
|
Weighted
Average Remaining Contractual Life |
Weighted
Average Exercise Price |
Options
Exercisable
as
of
December 31,
2008
|
Weighted
Average Exercise Price
|
|||||||||||||||||
|
$
|
2.00 – $2.99 | 18,500 | 3.7 | $ | 2.13 | 18,500 | $ | 2.13 | ||||||||||||||
| 3.00 – 6.99 | 28,750 | 1.5 | 3.73 | 28,750 | 3.73 | |||||||||||||||||
| 7.00 – 9.99 | 290,000 | 5.4 | 8.03 | 290,000 | 8.03 | |||||||||||||||||
| 10.00–12.99 | 55,640 | 6.3 | 12.85 | 55,640 | 12.85 | |||||||||||||||||
| 392,890 | 5.2 | $ | 8.12 | 392,890 | $ | 8. 12 | ||||||||||||||||
|
Shares
|
Weighted
Average Grant Date
Fair
Value
|
|||||||
|
Nonvested
shares at January 1, 2006
|
- | $ | - | |||||
|
Granted
in 2006
|
315,000 | 13.68 | ||||||
|
Vested
in 2006
|
(21,500 | ) | 13.77 | |||||
|
Forfeited
in 2006
|
- | - | ||||||
|
Nonvested
shares at December 31, 2006
|
293,500 | 13.68 | ||||||
|
Granted
in 2007
|
30,000 | 12.69 | ||||||
|
Vested
in 2007
|
(43,750 | ) | 13.76 | |||||
|
Forfeited
in 2007
|
(12,500 | ) | 14.57 | |||||
|
Nonvested
shares at December 31, 2007
|
267,250 | 13.47 | ||||||
|
Granted
in 2008
|
57,500 | 10.68 | ||||||
|
Vested
in 2008
|
(56,500 | ) | 13.00 | |||||
|
Forfeited
in 2008
|
(3,500 | ) | 14.85 | |||||
|
Nonvested
shares at December 31, 2008
|
264,750 | 12.76 | ||||||
|
2009
|
$ | 429 | ||
|
2010
|
375 | |||
|
2011
|
322 | |||
|
2012
|
308 | |||
|
2013
|
- | |||
| $ | 1,434 |
|
2006
|
2007
|
2008
|
||||||||||
|
Net
sales to Unaffiliated Customers:
|
||||||||||||
|
United
States
|
$ | 159,285 | $ | 156,602 | $ | 155,193 | ||||||
|
Canada
|
23,034 | 23,263 | 18,832 | |||||||||
|
Total
|
$ | 182,319 | $ | 179,865 | $ | 174,025 | ||||||
|
Identifiable
Assets by Geographic Areas at December 31,
|
2007
|
2008
|
||||||||||
|
United
States
|
$ | 50,499 | $ | 44,690 | ||||||||
|
Canada
|
6,254 | 2,795 | ||||||||||
|
Total
|
$ | 56,753 | $ | 47,485 | ||||||||
|
Year
Ended
|
||||||||||||
|
December
31,
|
||||||||||||
|
Revenue:
|
2006
|
2007
|
2008
|
|||||||||
|
Programmer’s
Paradise
|
$ | 53,744 | $ | 44,814 | $ | 56,893 | ||||||
|
Lifeboat
|
128,575 | 135,051 | 117,132 | |||||||||
| 182,319 | 179,865 | 174,025 | ||||||||||
|
Gross
Profit:
|
||||||||||||
|
Programmer’s
Paradise
|
$ | 7,284 | $ | 5,781 | $ | 6,509 | ||||||
|
Lifeboat
|
9,685 | 11,454 | 10,288 | |||||||||
| 16,969 | 17,235 | 16,797 | ||||||||||
|
Direct
Costs:
|
||||||||||||
|
Programmer’s
Paradise
|
$ | 3,386 | $ | 2,891 | $ | 2,876 | ||||||
|
Lifeboat
|
2,193 | 2,885 | 2,915 | |||||||||
| 5,579 | 5,776 | 5,791 | ||||||||||
|
Income
Before Taxes:
|
||||||||||||
|
Programmer’s
Paradise
|
3,899 | 2,890 | 3,632 | |||||||||
|
Lifeboat
|
7,491 | 8,569 | 7,373 | |||||||||
|
Segment
Income
|
11,390 | 11,459 | 11,005 | |||||||||
|
General
and administrative
|
6,584 | 6,305 | 6,415 | |||||||||
|
Interest
income
|
738 | 989 | 741 | |||||||||
|
Foreign
currency translation gain (loss)
|
3 | 2 | 3 | |||||||||
|
Income
before taxes
|
$ | 5,547 | $ | 6,145 | $ | 5,334 | ||||||
|
Selected
Assets By Segment:
|
||||||||||||
|
Programmer’s
Paradise
|
$ | 8,593 | $ | 18,329 | ||||||||
|
Lifeboat
|
17,347 | 7,529 | ||||||||||
|
Segment
Select Assets
|
25,940 | 25,858 | ||||||||||
|
Corporate
Assets
|
30,813 | 21,627 | ||||||||||
|
Total
Assets
|
$ | 56,753 | $ | 47,485 | ||||||||
|
First
|
Second
|
Third
|
Fourth
|
|||||||||||||
|
Net
sales
|
$ |
40,506
|
$ |
48,096
|
$ |
45,392
|
$ |
40,031
|
||||||||
|
Gross
profit
|
3,745
|
4,298
|
4,252
|
4,501
|
||||||||||||
|
Net
income
|
629
|
823
|
811
|
903
|
||||||||||||
|
Basic
net income per common share
|
$ |
0.14
|
$ |
0.19
|
$ |
0.18
|
$ |
0.21
|
||||||||
|
Diluted
net income per common share
|
$ |
0.14
|
|
$ |
0.18
|
$ |
0.18
|
$ |
0.20
|
|||||||
|
First
|
Second
|
Third
|
Fourth
|
|||||||||||||
|
Net
sales
|
$ | 46,922 | $ | 44,040 | $ | 41,790 | $ | 47,112 | ||||||||
|
Gross
profit
|
4,455 | 4,337 | 4,126 | 4,317 | ||||||||||||
|
Net
income
|
990 | 959 | 822 | 931 | ||||||||||||
|
Basic
net income per common share
|
$ | 0.23 | $ | 0.22 | $ | 0.19 | $ | 0.21 | ||||||||
|
Diluted
net income per common share
|
$ | 0.21 | $ | 0.20 | $ | 0.18 | $ | 0.20 | ||||||||
|
Description
|
Beginning
Balance
|
Charged
to Cost and Expense
|
Deductions
|
Ending
Balance
|
||||||||||||
|
Year
ended December 31, 2006
|
||||||||||||||||
|
Allowances
for accounts receivable
|
$ | 1,231 | $ | 501 | $ | 786 | $ | 946 | ||||||||
|
Reserve
for inventory obsolescence
|
$ | 31 | $ | 62 | $ | 41 | $ | 52 | ||||||||
|
Year
ended December 31, 2007
|
||||||||||||||||
|
Allowances
for accounts receivable
|
$ | 946 | $ | 109 | $ | 147 | $ | 908 | ||||||||
|
Reserve
for inventory obsolescence
|
$ | 52 | $ | (2 | ) | $ | 11 | $ | 39 | |||||||
|
Year
ended December 31, 2008
|
||||||||||||||||
|
Allowances
for accounts receivable
|
$ | 908 | $ | 457 | $ | 279 | $ | 1,086 | ||||||||
|
Reserve
for inventory obsolescence
|
39 | $ | 15 | $ | (2 | ) | $ | 56 | ||||||||